

US Markets Remain Extremely Overvalued!
US markets remain extremely overvalued relative to historically-reliable indicators.
One such indicator is the Shiller PE ratio, which measures the current market price to its average earnings over the last 10 years, smoothing out distortions from bull market peaks and bear market troughs.
Most importantly, the Shiller PE is over 90% correlated to long-term market returns.
In other words, it is extremely accurate.
Question: So what is the Shiller PE saying right now?
Answer: As of this writing, the market is 65% overvalued relative to its historical average (see Chart I below)!
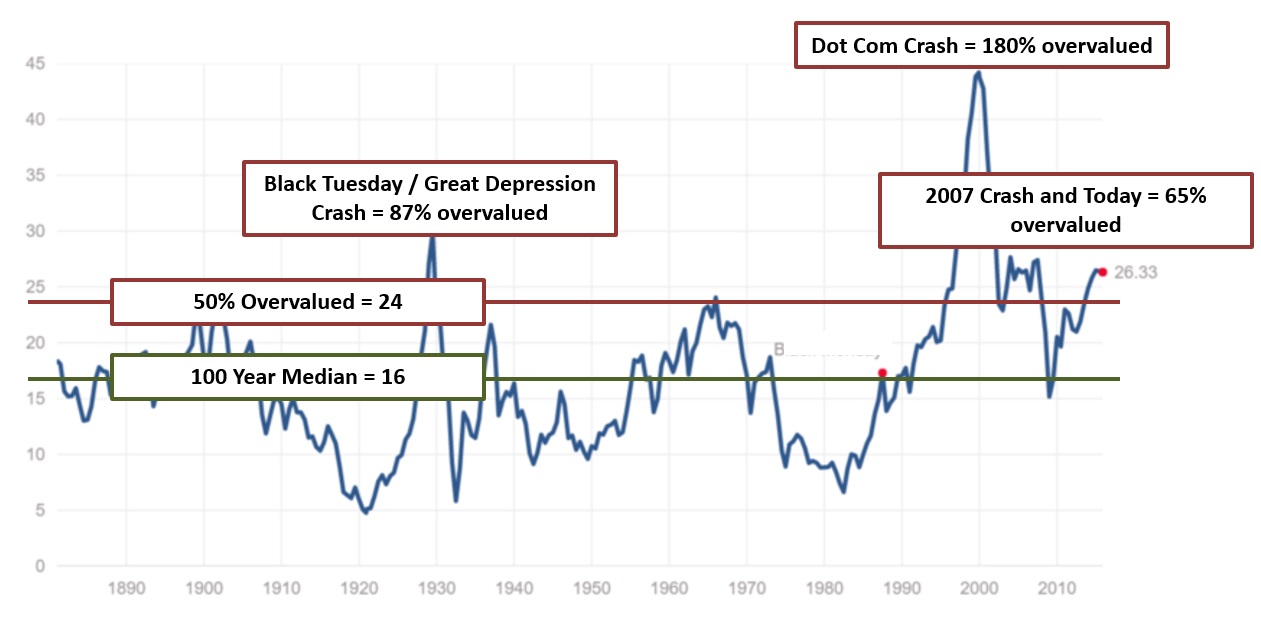
Chart I – The Shiller P/E Ratio Is Higher Than All Previous Peaks (with the exception of the Great Depression and Massive Dot Com Bust)
Holding On For Dear Life
The global bull market that began in early 2009 started running out of steam in mid-2014, with global equities steadily declining since.
This decline has matched the “common sense” news flow we hear daily, “economic weakness in Europe, geopolitical tensions, and slowing Asia (in particular China).”
However, US equities held out for longer, only peaking in the Spring of 2015.
Many attribute the longer US cycle to the US Federal Reserve’s extraordinarily accommodative policies of zero interest rates and Quantitative Easing.
These policies have allowed major US companies to borrow heavily and at low rates, using proceeds to boost market prices through an unprecedented level of share buy backs.
The zero interest rate policy has also encouraged risk seeking for investors who have had no ability to generate returns in fixed income.
The result has been a sideways tug of war between excessively high valuations and manipulation-influenced investment flows into US markets (see Chart II below).
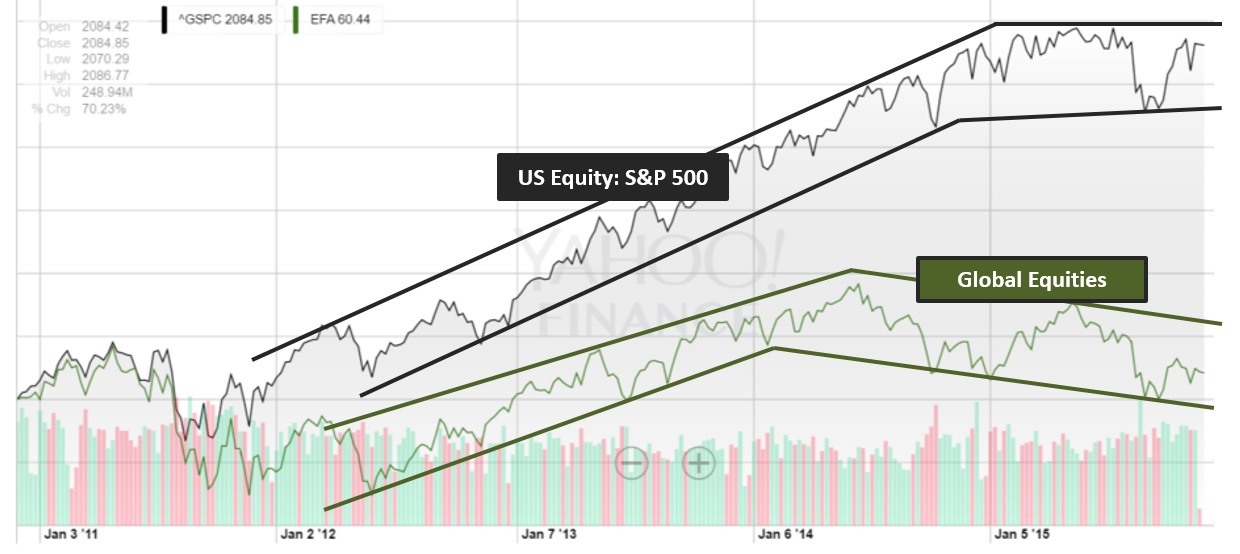
Chart II – US and Global Equities Are No Longer Tracking Their 5-Year Bull Market Trends
If we were in a more reasonably-valued scenario, we might view the US equity sideways pattern as a healthy consolidation before a resumed bull market.
And a last-gasp final hurrah to nominal new highs is indeed possible in the months and quarters ahead (it is always surprising just how extended markets can get on both the upside and downside, before reality sets in).
But alas, we are not in a reasonably-valued scenario.
Instead, we find ourselves with markets significantly overvalued, Fed easing near an end, and the weight of the global economy catching up to US equities.
From our perspective, US equity markets are just barely hanging on.
Let’s explore the weakness continuing to develop under the surface…
Underlying Weakness Suggests Recession Likely Ahead
We often discuss the various indicators which are bandied about in the financial media.
Many go in and out of favor based on whether they have displayed short-term predictive value or not.
For example, the number of “clicks” was viewed as a more reliable indicator than traditional PE ratios during the Dot-Com bubble.
We all know how that ended.
More recently, there is an obsession with improvements in lagging indicators such as employment and Fed interest rates.
However, it is the leading indicators that tell us how the economy should perform in the months ahead, rather than a lagging report card on what has already happened.
One of the most predictive leading indicators is new factory orders.
When new orders are heavily on the decline, we have seen a recession follow 7 out of the last 9 times since 1970.
There was indeed a false alarm in 2012, but new orders are flashing a very heavy warning sign again today (Chart III below):
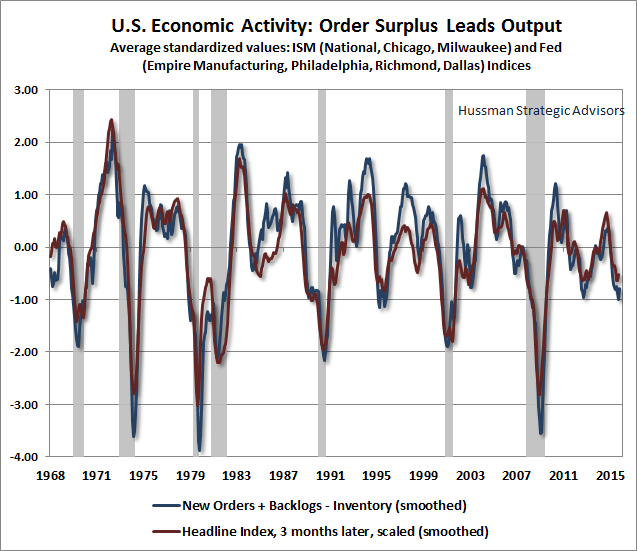
Chart III – Rapidly Declining New Orders Have Predicted Recessions 7 of the Last 9 Times (Grey Bars)
Another highly predictive indicator is corporate profit margins.
Like most things in life, profit margins go through cycles of ups and downs.
There are time periods when companies have the upper hand and generate massive margins, followed by time periods where input costs such as labor, raw materials, and overhead become more expensive, and profit margins contract.
As illustrated in Chart IV below, when profit margins have contracted at a similar level as they have today, recessions has followed in nearly every single instance thereafter.
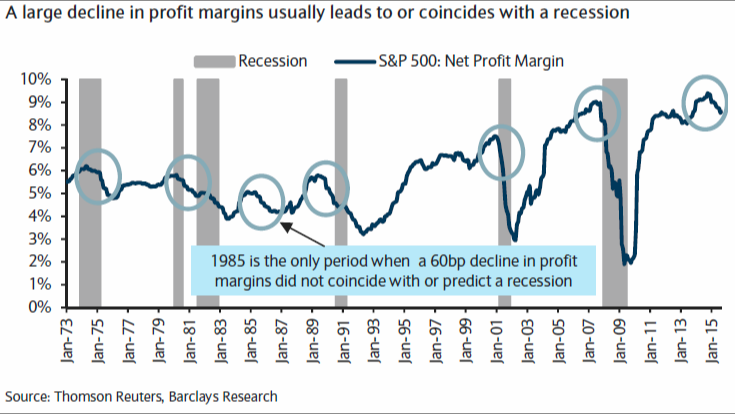
Chart IV – S&P 500 Profit Margins & Corresponding US Recessions
We highlight these recession-predictive indicators because US markets have typically fallen by 30% or more when accompanied by a US recession (as opposed to just a 20% price correction without an economic recession).
This magnitude of decline is absolutely consistent with our current expectations based on recently measured market levels of overvaluation.
In fact, it may even be small, as eventual declines could be as high as 40-50% in order to fully achieve a fairly valued market.
We do not want to alarm you, only inform you as to what history tells us should be ahead.
Please read the section below to review how your portfolio is prepared for such an outcome.
LGA Outlook & Portfolio Positioning
We have been conservative with investments and warning about potential declines for nearly two years now.
Globally, this has been the right move.
We have avoided most of a 10% decline in foreign developed markets, a 20% decline in foreign emerging markets, and a whopping 40% decline in commodity markets (50-60% in energy markets alone)!
In the US, this conservative positioning has yet to pay dividends, with markets chopping sideways in the past 2-3 quarters, and not yet declining meaningfully.
For our accredited clients, we continue to allocate idle cash to recession-resilient private opportunities with growing income checks that are paid monthly or quarterly.
For all clients, we continue to protect portfolios with cash, hedges, and market-neutral funds…while patiently waiting for the coming opportunity to put your money back to work.
Do not fear the public bear market ahead, as our heavy protection will protect portfolios, and cheaper prices will present a wonderful buying opportunity.