

As we occasionally have written about, the US Federal Reserve’s massive manipulation of interest rates is not just about unprecedented low levels, but also about the duration of the distortion.
Looking at Chart I below, we can see that obscenely low 0% rates were only hit once previously in the 1950s, and even then for just a passing moment.
Additionally, each time a recession hit (grey bars in Chart I), the Fed quickly normalized rates back to higher levels after initially reducing them to help provide stimulus.
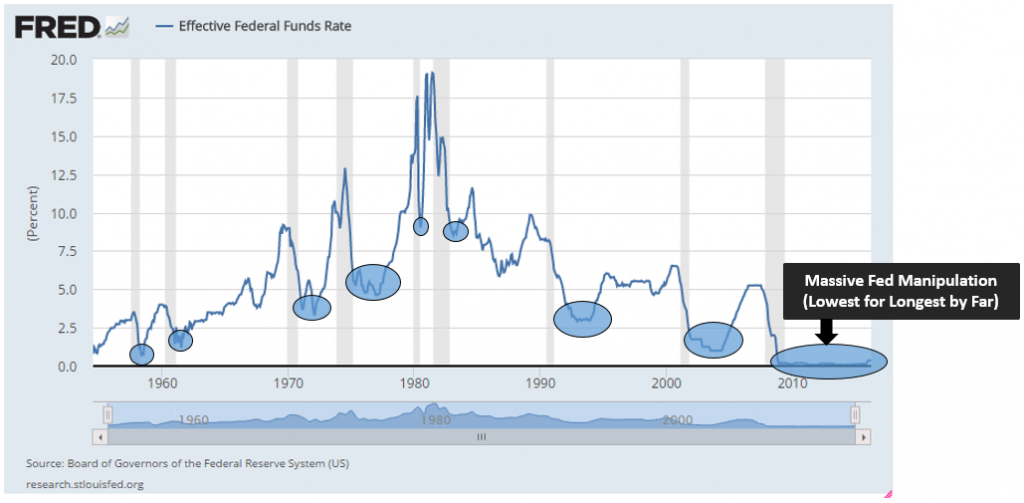
Chart I – Historical Fed Funds Rates (Interest Rates Controlled by US Federal Reserve Bank)
However, in our most recent cycle, the massive accommodation at 0% remained in place for nearly seven years from 2009 until December 2015!
And even today, at 0.25% it remains at unprecedented and heavily distorted lows, despite all mandated employment and inflation targets having been hit years ago.
What this means is that the economy is being driven to excess capacity relative to its natural rate, because low interest rates spur higher consumption & investment than a more natural level.
For example, with borrowing costs so low, more houses, cars, equipment, etc….are built and sold at ever higher pricing levels.
While many worship at the feet of the Fed, their distortions lay the seeds of boom & bust cycles, just as they did during the last two bull / bear cycles (e.g. dot com and real estate).
Rather than worship this institution, we suggest people recognize them for what they are…
…the national drug pusher giving the US patient ever increasing doses of low interest rate drugs to produce weaker and weaker highs, while eventually causing an overdose and subsequent crash.
Far more healthy would be to stop the manipulations and let the patient experience more reasonable ever-day highs and lows.
The Situation Is Worsened By The Fed’s Unlimited Printing Press
Consider that prior to 1913, the Fed’s founding year, the purchasing power of the dollar was reasonably stable under the gold standard.
However, while gold has significantly held its purchasing power, the dollar has lost nearly 97% of its value since 1913.
Further, the decline accelerated after a fully fiat currency was instituted in 1971 as the value of the dollar was unhinged from gold (see Chart II below) and the Fed fired up the US dollar printing presses without the gold wealth needed to back it.
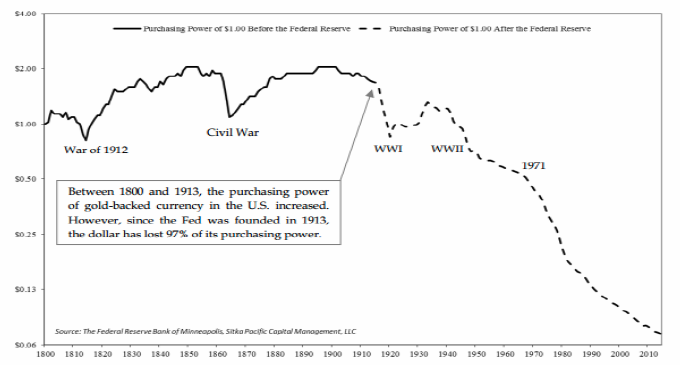
Chart II – Historical Purchasing Power of the US Dollar
So we have a Fed that continues to steal growth from the future, to create multiple bubbles that eventually pop, and to destroy the value of the US dollar over the long-term, making everything more expensive.
As a comparison, I can remember as a child visiting Switzerland 30 years ago and receiving 3 Swiss Francs for every US dollar I exchanged. I thought it was a great deal, and it was.
Today, a US tourist receives less than 1 Swiss Franc for every US dollar! Essentially, the US dollar has declined by 67% relative to the Swiss Franc.
And, it’s not as if prices are rising everywhere so it just is what it is. Instead, prices are only rising in places like the US where currency is being depreciated.
It’s really quite shocking.
So milk is more expensive, housing is more expensive, medicine is more expensive. Basically, everything becomes more expensive.
But for this current blog, we are going to focus on yet another unintended consequence of the Fed’s action.
We will focus on how it has created an environment that is completely devoid of opportunity and yield.
A Futile Search For Yield & Return
Many investors are desperate for yield (otherwise defined as income from investments).
Pension funds, endowment funds, and ever-growing masses of baby-boomer retirees are truly in need of low-risk yield.
These organizations and individuals need it to pay for ever-increasing daily expenses…ones that we already discussed above.
Even younger folks appreciate the benefits of consistent yield, as it can help them navigate their day-to-day needs, and they can track consistent investment progress as compared to the public market roller coasters.
So let’s review a few of the more major investment asset classes that have been impacted by the Fed’s manipulations.
Bonds
First off, bonds have traditionally been one of the most conservative asset classes available to investors.
But low interest rates have driven bonds to extremely low yields, paying out at 100-year lows (see Chart III below).

Chart III – Historical Interest Rate Payouts of “Safe” 10 Year US Treasury Bonds
Furthermore, if rates were to rise, the actual underlying bond would decrease in principal value.
Understand that if you own a piece of paper that pays out 2%, and rates subsequently rise to 3%, your 2% bond is worth less than newly issued ones, so the price for your 2% bond declines.
The net-net is that at best investors can expect 2% yields, and more likely they will have flat to negative returns going forward if interest rates ever rise and the value of their bond decreases.
That is a terrible return proposition.
Investors that blindly follow the 4% annual returns pitched by efficient market enthusiasts will be sorely disappointed in the years ahead.
US Equities
Next, we take a look at US public market stocks, the most popularly understood and owned asset class.
Dividends are the extra earnings that companies deliver back to investors in the form of direct payouts.
This too is an important source of yield for many investors.
Once again, given significant distortions and overvaluations, dividends are also at extreme lows (see Chart IV below).
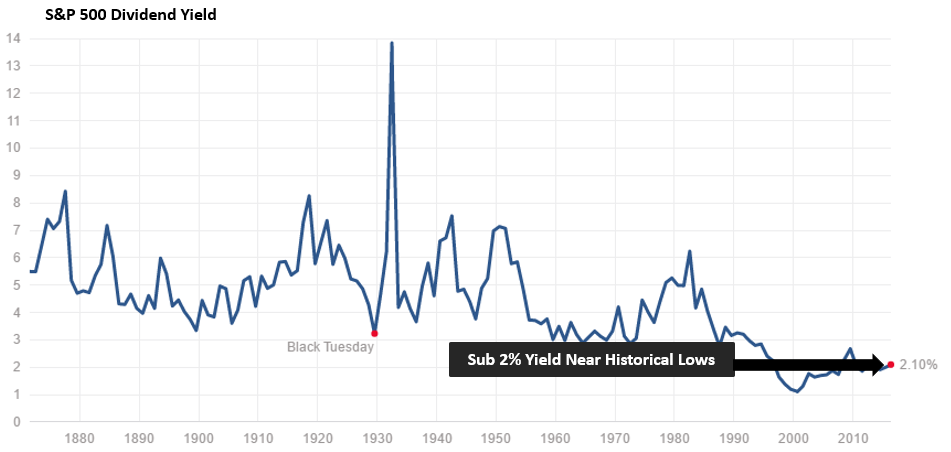
Chart IV – Historical US Stock Dividends (Source: www.multpl.com)
So with no yield in bonds, no upside in bonds, and no yield in stocks…all that could remain is upside in the price of stocks.
But here too we see prices are at near 100 year historical overvaluation peaks when we look at our favorite indicator the Shiller PE (referenced in many previous blog posts).
For this post, we highlight another reliable indicator, the Market Cap of all US stocks divided by the GDP (Gross Domestic Product) of the US.
This just happens to be one of Warren Buffet’s favorite valuation metrics (see Chart V below).
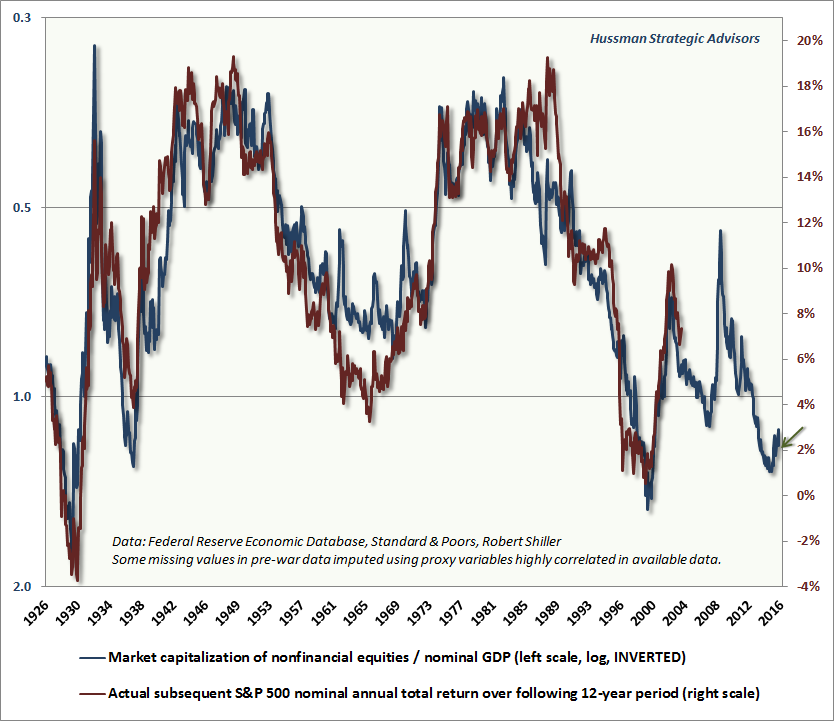
Chart V – Historical Market Cap to GDP As An Accurate Predictor of 10-Yr US Stock Market Returns
Here too, valuations are so high that a paltry 2% per year return is expected over the next 10 years, not enough to even keep up with inflation.
It’s Not Just Investments, It’s the Economy Too
Many argue that the high valuations aren’t that bad, because low interest rates justify higher prices.
They argue that unless the economy struggles, we should be ok.
Notwithstanding the fact that “should be ok” means 2% maximum returns, the reality is that the economy is also potentially on the verge of decline.
Historically, when corporate profits fall substantially and sustainably, as they are now, corporations begin to cut back on capital investment and then employment (see Chart VI below).
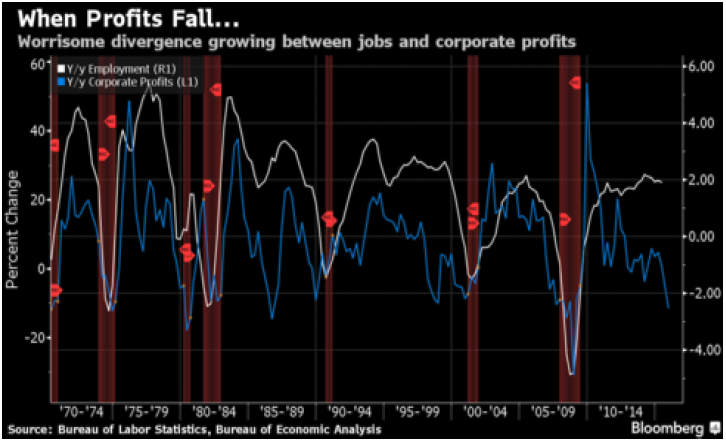
Chart VI – Corporate Profits, Employment, and Corresponding Recessions (Courtesy BLS, BEA, Bloomberg)
We aren’t yet in a recession, but the leading indicators to previous recession are kicking in heavily now.
We also see that world trade in dollars has fallen very sharply since oil prices peaked in the summer of 2014 (see chart VII below).
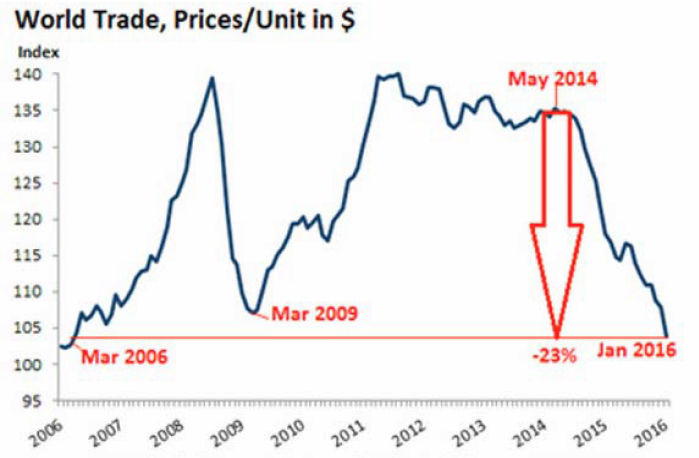
Chart VII – World Trade in Dollars (Courtesy Wolfstreet.com)
Levels have fallen so low, that it too is a heavy concern for global growth going forward, having breached lower levels than even during the 2009 Great Recession.
Net-Net = Play Heavy Defense While Waiting for Opportunity
The net-net is while many people are indiscriminately stretching for return, we think it is best to keep higher levels of cash and to hedge portfolios.
With possible 0-2% annual returns on the upside, and a likely 40-50% decline on the downside, we would rather let others pick up pennies in front of steamrollers, while we will remain ready to peal them off the floor once prices have been flattened.

Of course we can never predict exactly when the timing will occur, but the current situation reminds us of a quote from one of our favorite colleagues John Hussman.
“When you insist on tap dancing at the edge of a fragile cliff, or lace up your skates when the ice is thin, each moment of success may offer false encouragement to press your luck, but it also ensures that you’ll have no escape when underlying risk inevitably meets an occasion to express itself.”
– John Hussman
What Else Can Be Done While Waiting?
Even if patience and prudence is the right course of action, it can be frustrating for investors to sit on their hands in boredom while waiting for the overvaluation to eventually be corrected.
They may be tempted to buy on shallow dips, and they may even sometimes be rewarded.
However, we would advise waiting until much deeper declines are realized and more attractive undervaluation levels materialize.
One other major theme we have exploited is in private cash-flow investing, especially in more inefficient markets where greater return possibilities exist.
For accredited clients, we will be coming out with a new quarterly update on the LGA private investing program tomorrow…where we are currently generating 8-12% of annualized cash flow in recession-resilient opportunities.
For non-accredited clients, we continue to work with them to increase income-producing and savings activities…so that they may too aspire to accredited status and soon access these consistently yielding private opportunities.
Stay tuned for further updates, and we will be sure to strike quickly when the opportunities arise.