

LGA is constantly evaluating the universe of investment options in both the public and private markets.
We continue to see a major disparity in valuations between these two choices.
We discuss this disparity below, along with our practical recommendations for clients:
- Public Markets (Red Light)
- Private Markets (Green Light)
Public Markets (Red Light)
We have been warning clients of public market overvaluations for nearly three years now.
Staring in May 2014, we began moving tactical clients into a more defensive positioning, while reducing expectations among fully invested clients.
Since that time, US public equities are the only asset classes to have risen, while the remainder of the world is still down (see Chart I below):
- US equities are up 22% (blue line)
- US fixed income is down 1% (light blue line)
- Emerging markets are down 8% (pink line)
- Foreign developed markets are down 11%+ (green line)
- Commodities are down nearly 40%+ (purple line)

Chart I – Global Returns Since LGA Bearish Call in May 2014
During Q1/2017, equities gained slightly, fixed income was flat, and commodities declined once again.
Our main thesis still holds that valuations are at obscene levels, particularly in the US, and that public markets are ripe for major declines.
Below is an update to one of our favored valuation metrics, the Shiller PE ratio, which is 93% correlated to 10-yr stock market returns.
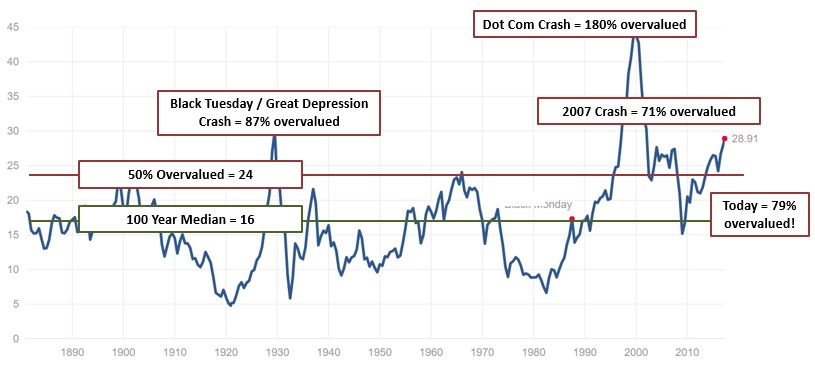
Chart II – The Highly Accurate Shiller PE for the S&P 500 in the US (Now 79% Overvalued)
Valuation metrics can never predict the exact timing of bear markets, but they do inform us as to whether investments are attractively priced or not.
As we have highlighted before, markets would require a 40-55% decline in order to simply get back to what has historically been “fair value.”
Of course, this doesn’t mean that markets cannot continue to rise, as they tend to do near bubble market peaks.
Further gains are always a possibility.
However, when bear markets arrive and prices begin to decline, they tend to do so with a speed and magnitude that is difficult to avoid.
For example, there were days during the 2008-2009 decline when investors woke up to specific holdings down 50%+ at the market open.
There was no time to get out.
This bear market behavior is pretty typical, and there is no getting around it.
As such, we continue to hold excess cash and market hedges for tactical risk on / risk off investors.
For fully invested clients, we continue to advise a long-term outlook, and where possible, a more conservative risk profile.
Full market cycles are always completed and the current equity bull market is not a permanent “new normal.”
Private Markets (Green Light)
Private investments have historically delivered 35-65% higher returns than public investments (13.4%/yr for private vs 8-10%/yr for public).
The driving force behind this is a typical 25-40% discounted starting level, to compensate investors for tying up their money privately.
There simply are fewer investor dollars in private markets versus public markets.
Think about it.
There is massive participation in public markets, with individual accounts, retirement accounts, 401Ks, 403bs, pension funds, endowments, mutual funds, ETFs, etc.
In contrast, private markets require investors to be accredited ($1MM minimum net worth), have access, and have willingness to tie up their money for longer periods of time.
It’s Econ 101.
Lower supply of dollars to private markets means investments need to be offered at a more attractive (lower) price, and hence the typical 25-40% discount.
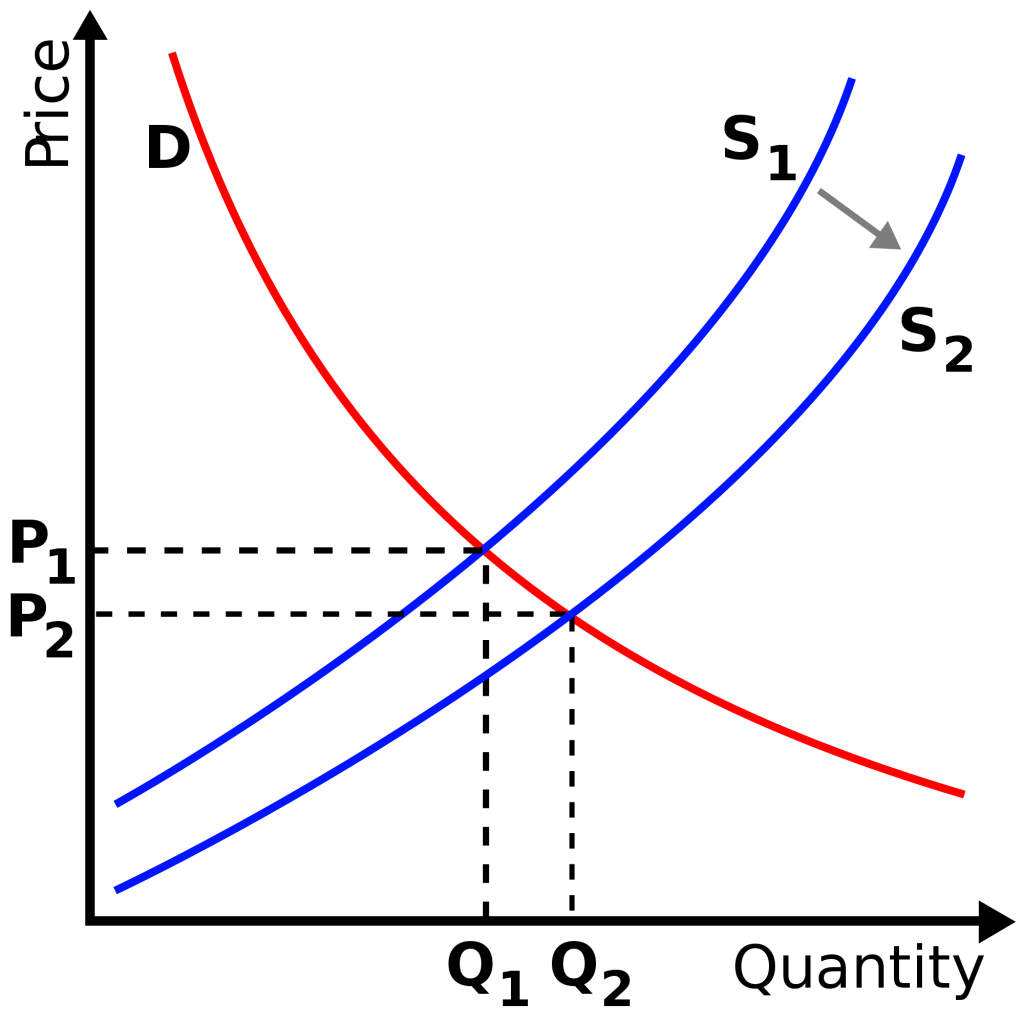
Chart III – Econ 101: As supply is decreased (S2 vs S1), the price to purchase declines as well (P2 vs P1)
However, this relationship has been even further stretched this past decade.
Private market funding has been severely restrained by the market’s reactions to two supposedly consumer-friendly regulations installed during the last two financial crises: Sarbanes-Oxley (2002) and Dodd-Frank (2010)
Since these regulations were instituted, over 60,000 community banks have closed.
Assets from these local banks have been consolidated at the major powerhouse banks such as Wells Fargo, JP Morgan, and Bank of America.
So much for regulation protecting the consumer…it has perversely killed off competition and made the “too big to fail” banks even bigger.
These small community banks were the backbone lender to their local communities, lending money for construction, equipment finance, business credit lines, etc.
They did so by having 1-on-1 relationships with business owners and individuals, and truly understanding and underwriting risk.
Today, the big three banks are focused much more on “vanilla” lending such as those backed by an asset (such as your home or a commercial property).
The net result has been a serious lack of funding to nuts-and-bolts private markets, and hence serve undervaluation.
Let’s take a look at some examples from three private areas where our clients are participating (chart IV below):
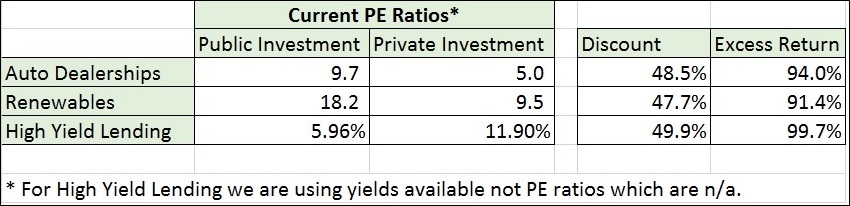
Chart IV – Current examples of LGA private equity and debt investments, and their deep discounts relative to public alternatives in the exact same industries
It is astounding to see how private investment return expectations are today nearly double (90%+) those of their public market counterparts!
For sure there are overpriced private markets as well, especially in the venture capital and technology-related start-up sectors.
Our focus for private investments is in the “nuts-and-bolts-of-America” such as: infrastructure, small-business lending, affordable housing, etc.
LGA clients are simply taking advantage of these mass valuation distortions, ironically driven by government interventions in the past decade and a half.
Go Forward Game Plan
As we have suggested previously, fully-long index investors should expect muted returns in the 10 years ahead as earnings catch up to prices.
Additionally, fully-long investors should expect a major bear market or two at some point in between.
Looking out further to 20-30 year projections, the return expectations begin to improve a bit, but will still be below historical 8-10%/yr averages given the high valuation starting point of today.
For tactical clients, we will remain in a risk-off positioning with public markets.
In all cases we are increasing client allocations to private investments where possible.
Our feelings are this is a once-in-a-generation valuation gap that must be taken advantage of.
In just the last quarter, client allocations to private investments increased from 25% to 33% of our total assets under management.
We do still recommend keeping some liquidity in public markets in order to pounce when they do eventually meaningfully decline.
As always, we are laser-focused on protecting your assets while finding intelligent opportunities to drive superior risk-adjusted long term returns.
Make. Life. Count.