

Global Economy and Corporate Profits Remain Relatively Healthy
Economic growth continues to be modestly healthy.
While US GDP has been hovering within an anemic 0-2% growth range, a recent 3% result was posted in July (see Chart I below)
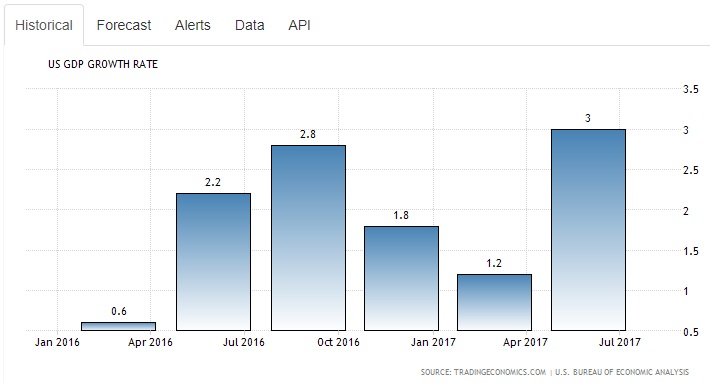
Chart I – US GDP Growth Rates For Past Six Calendar Quarters
Will this 3% growth rate persist or was it a one-time outlier that reverts back downwards in future quarters?
A big positive has been a surge in small business optimism since the late 2016 presidential election (see Chart II below).
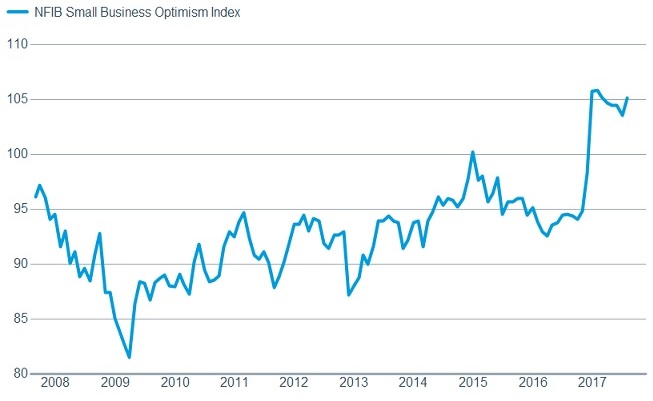
Chart II – NFIB Small Business Optimism Index
Additionally, large businesses are hiring, which is a sign of economic health and optimism (see Chart III below):
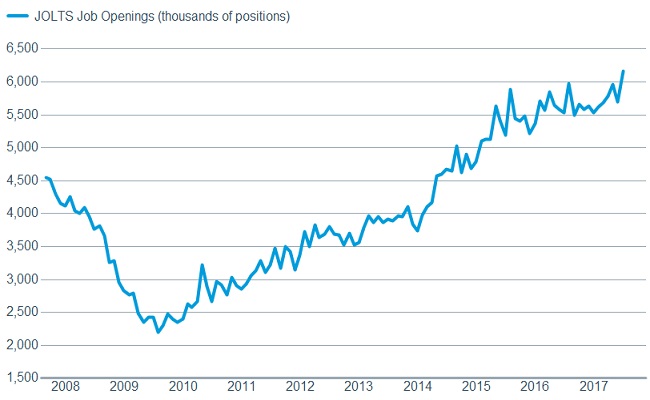
Chart III – JOLTS Job Openings
Outside of the economy, corporate profits are a more correlated driver of stock market returns.
As such, it is important to look at profit trends when predicting future investment returns.
What we see here is that corporate profits rebounded from the 2008-2009 recession lows, but have wavered since late 2014 (see Chart IV below).
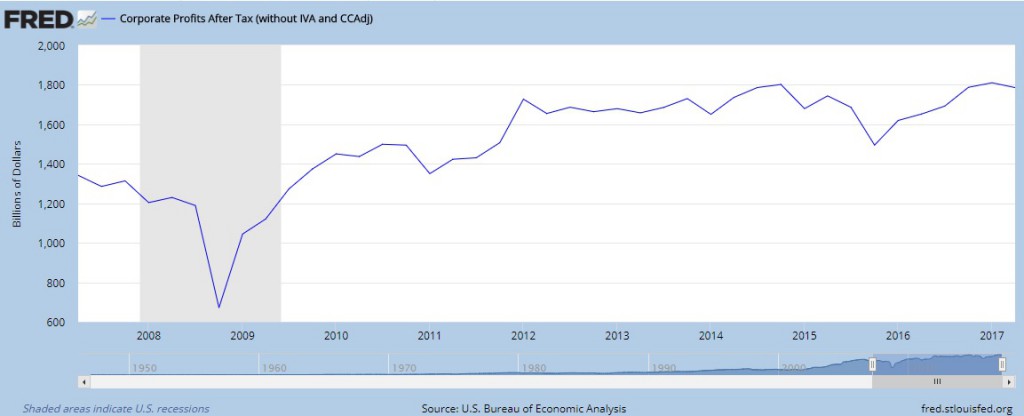
Chart IV – US Corporate Profits after Tax
Danger Lingering in the Background
While current economic and profit measurements remain reasonably positive, danger lingers in the background.
A well researched study by Harvard professors Reinhart and Rogoff illustrates how GDP is depressed when public debt levels rise above 90-120% (see Chart V below).
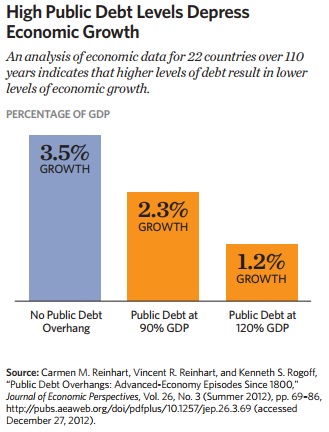
Chart V – GDP Growth Versus Public Debt Overhang
Q: So where does the US currently sit?
A: The US is currently at a dangerous 104.3% public debt-to-GDP ratio, which puts us squarely in the 2% max growth camp going forward.
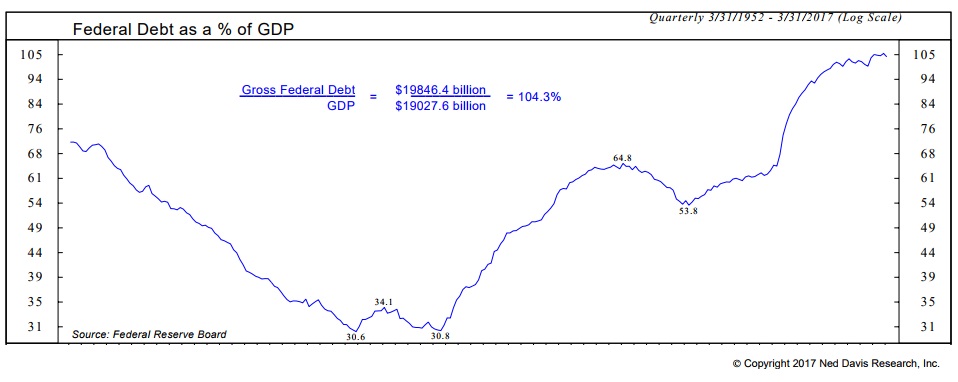
Chart VI – US Public Debt as a % of GDP
As a result, the weak, sub 2% growth trend is far more likely to persist versus the recent 3% quarterly spike being the expected norm going forward.
Further, projections suggest that US-debt-to-GDP is likely to explode far higher in the coming decade, with debt interest and entitlement spending continuing to accelerate each year.
The Fed Reserve has been fighting this battle by keeping interest rates low (high rates would absolutely explode deficits and debt levels, with GDP imploding as a result).
Consequently, the Fed is being forced to stay low.
But this “boxed-in” position will fundamentally reduce fixed income returns for decades to come; good luck if your financial plan relies on a standard 4% fixed income return projection.
Worse still is the lack of leadership from both parties of Congress in tackling our country’s financial woes.
A plan is desperately needed to increase growth while dramatically cutting government spending.
Like any household in financial difficulty, the answer is to make more money and spend less.
Congress’ inability to make tough decisions will end up harming everyone in the long-term (now no longer long-term, but more mid-term).
Further, the previously quoted Reinhart and Rogoff study found that a 110% level has historically been the marker of a country’s “point of no return,” with default or hyperinflation as the only exit thereafter.
If you would like to learn more, click here for a concise, fact-based white paper on the debt-to-GDP topic: How the United States’ High Debt Will Weaken The Economy And Hurt Americans
Corporate Profits May Become Strained As Well
Remember again that corporate profits are more highly correlated to stock market returns than economic growth like GDP measures.
Here too, we are seeing pressures to corporate profits.
Demand for workers is increasing (Chart III above), and supply for workers is decreasing (we are now at very low unemployment levels).
From our Econ 101 classes:
Higher Demand + Lower Supply = Higher Prices
In this case, the higher prices are in the labor market, which is a typical late bull-market characteristic.
While healthy for workers, labor price increases put pressure on corporate profits.
Until now, companies have abated these wage pressures using two approaches:
- Technology was used to replace human workers
- Financial engineering was used to increase earnings per share (EPS); record levels of low-interest debt was raised to buy back shares of stock so that flat earnings showed as higher EPS.
The technology trend continues to be rather durable, albeit productivity metrics have recently been in decline.
Financial engineering, however, is on the decline, as the Fed raises interest rates and makes the cost to borrow higher than it was in previous years.
CFOs are not going to refinance low interest-rate debt from 2014-2016 with higher interest-rate debt in 2017.
As such, these profit supports are becoming strained and the levies may soon breach.
How Will It End
One can never exactly predict the ending of a story.
We can, however, rely on the past as an indication of what we can expect ahead.
Clearly, if profits continue to stagnate, while stock prices increase, valuations will become more and more strained.
For a great visual of this dynamic, see Chart VII below, which illustrates how the S&P 500 has more than outpaced corporate EPS growth since 2012.
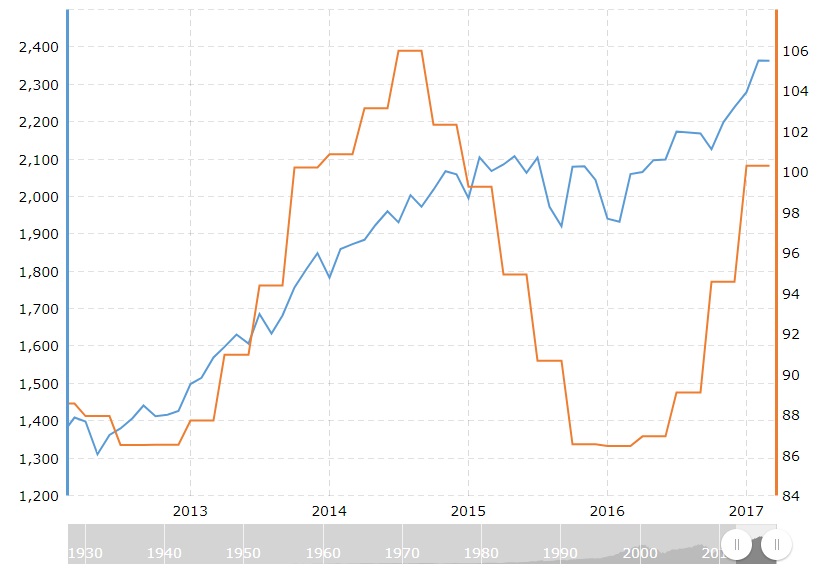
Chart VII – S&P 500 (blue line) Rising Far Faster than Corporate EPS (orange line)
This increased pricing combined with lower profits results in ever-increasing and obscene market valuations.
Chart VIII below is a recent update to one of our favorite valuation metrics, The Shiller PE.
Shiller PE is now 88% overvalued, as compared to 83% overvalued last quarter, and is now more expensive than pre-Great Depression levels.
With corporate profits staying as is, this represents the potential for a 45-50% drop in the S&P 500 just to get back to average valuation levels!
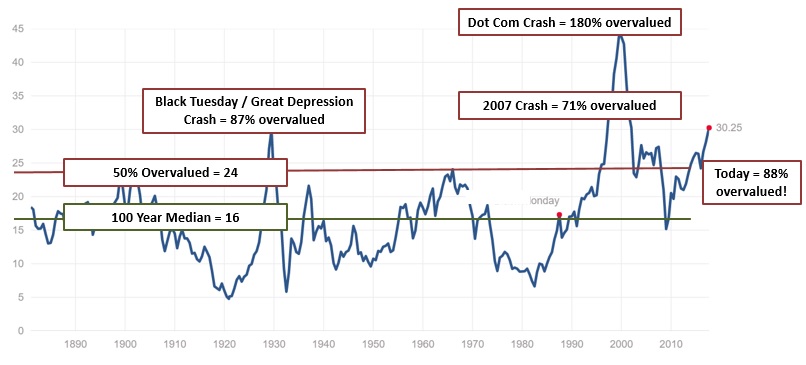
Chart VIII – The Highly Accurate Shiller PE for the S&P 500 in the US (Now 88% Overvalued)
Furthermore, bear markets typically do not stop at fair market valuations.
Instead they tend to overshoot to the downside.
If we combine current overvaluations, the EPS declines, and downside overshoots, we are looking at a 50-65% potential decline when the bear market finally arrives.
Of course the million dollar question is, “when will it all happen?”
We wish we could tell you.
But we are confident that picking up pennies in front of a steamroller is a reward vs risk profile that doesn’t make sense.
Action Items
So what can one do?
We have long been recommending a focus on major demographic trends, along with investments in areas with far more attractive valuations.
One such trend in the US is the mass amount of baby boomers who are retiring, focusing on lifestyle, downsizing, moving west, and needing to figure out how to live on a reasonable budget.
This leads us to the following areas:
- Development of cutting-edge transitional care facilities for improved health care outcomes
- Increased supply and improved quality of affordable housing
- Increased supply of self-storage facilities for all the “stuff” that lingers after a downsizing
- Life settlement sales to reduce annual budgets and increase investment nest eggs
These are just a few bricks and mortar ideas that will find consistent demand in the decades ahead.
Additionally, their valuations in the private markets are quite reasonable, and offer a far better reward-to-risk ratio than public markets today.
Finally, many of these areas have a recession resilient component to them which should help withstand the next bear market.
Wishing you all a wonderful end of summer and beginning of autumn.
We also are sending our thoughts and prayers to the many folks who have been affected by the floods and devastation in Houston.
Please let us know if we can help in any way.