

2020 was undoubtedly a historic year, producing emotional overload for many!
However, the world continued to move forward and there were still some positives to focus on (as there always are).
Creators continued to create, producers continued to produce, and most people once again proved to be resilient to the challenges they faced.
At LotusGroup, we focused on stoicism, stability, optimism and getting the job done for clients and investors.
As 2021 begins, we look forward to the fresh start that each new year brings!
We also look forward to the traditions and obligations that unite us all in this adventure called life.
In short, we are excited for 2021 and our time together with you.
2020 Public Market Recap – From Bear to Bull
2020’s early year bear market was one to write home about.
Coronavirus sent global equity markets plunging in Q1/2020 (see chart I below)
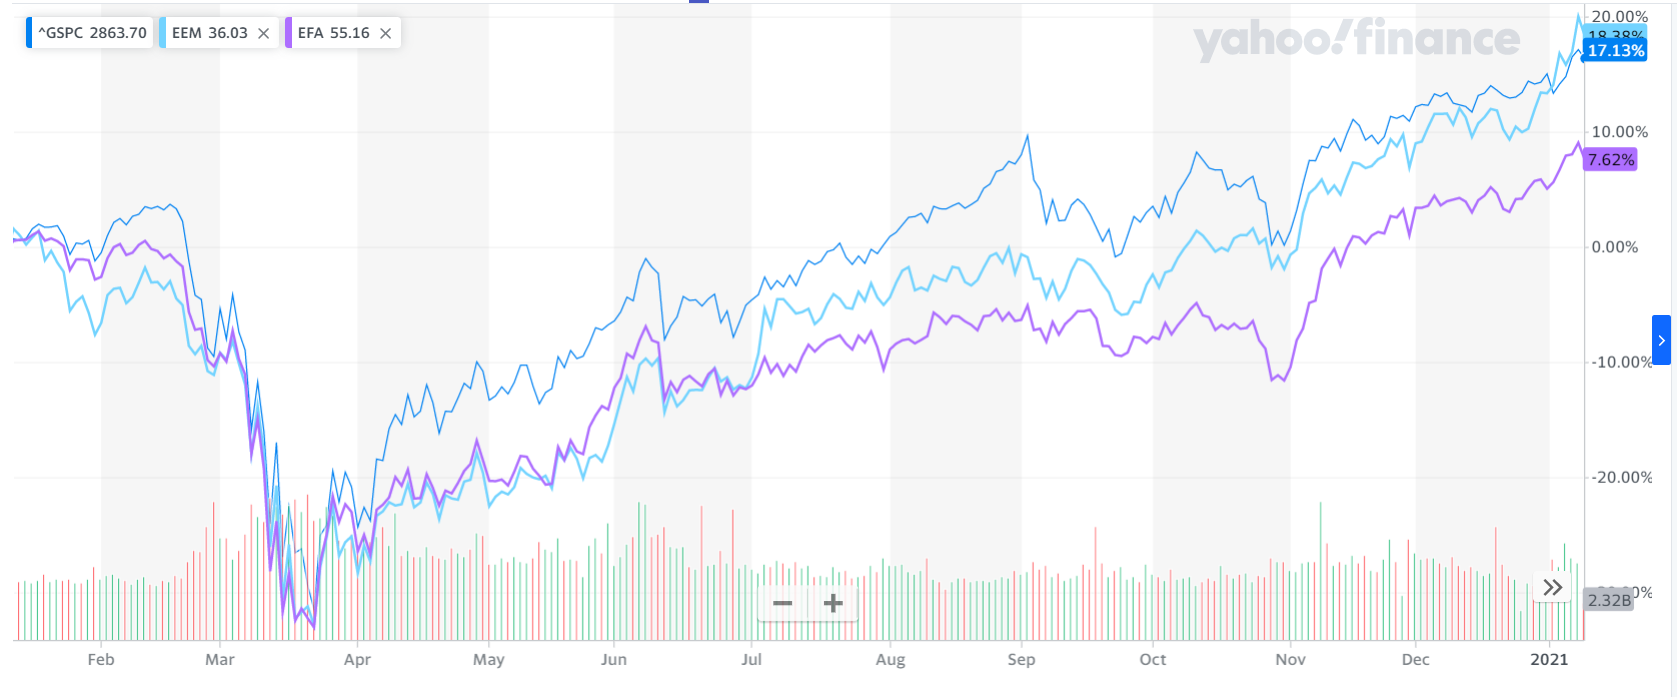
Chart I – S&P 500 vs. Emerging & Foreign Developed Equities (Source: Yahoo Finance)
LGA distributed a client webinar in the midst of the Q1 chaos, highlighting the fastest bear market decline in the past century and what potential paths lay ahead.
Subsequently, a new bull market was established in Q2-Q3, with a powerful and rapid recovery.
Historically, 25-30% stock market declines are rarely retraced to the upside as rapidly as what occurred with the mid-2020 rebound.
Much of the recovery was predicated on massive and coordinated global stimulus, including a whopping $2 trillion package in the US.
The Coronavirus Aid, Relief, and Economic Security (CARES) Act was the largest relief bill in US history.
It was also one of the fastest to be approved and implemented, providing the economy with financial relief in coping with the mandated lockdowns.
Where Does That Leave Us?
Today, many equity markets are sitting at new highs, in fact at prices eclipsing their pre-COVID levels.
Putting 2 and 2 together, if the economy and corporate profits are not yet fully recovered, but prices are higher…
…that means valuations are now higher than they were prior to the 2020 crash.
Chart II below illustrates our favored valuation metric, now sitting at over 100% overvalued relative to the historical mean.
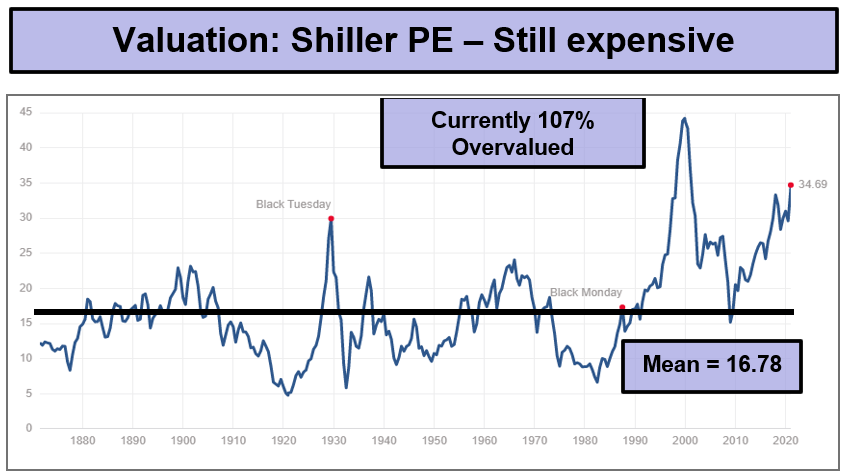
Chart II– Shiller PE Ratio (Source: Multpl)
Certainly the $2T stimulus package was a major driver of the equity price surge, along with the expectation for more stimulus ahead in 2021.
The Fed-induced low interest rates also helped to dramatically reduce borrowing costs, which triggered greater debt borrowings and equity purchases.
So what’s the downside?
Our government’s balance sheet has taken on trillions of dollars of new debt obligations, so the longer-term outlook is increasingly strained (as if it weren’t already).
For the time being, the market focus is on positive short-term factors.
At some point, the longer term factors will become more relevant again.
Opportunities in a Post-Covid World
As with any major dislocation, COVID has provided a myriad of different investing opportunities.
As we mentioned previously, there are several positives that are helping in the near-term.
- Government stimulus has provided support
- The release of various effective vaccines has provided optimism
- New investment themes have emerged while hard-hit sectors are now trading at discounted values
What sectors will grow?
What sectors will recover?
How do you take advantage of new trends (see chart III below for some initial ideas)?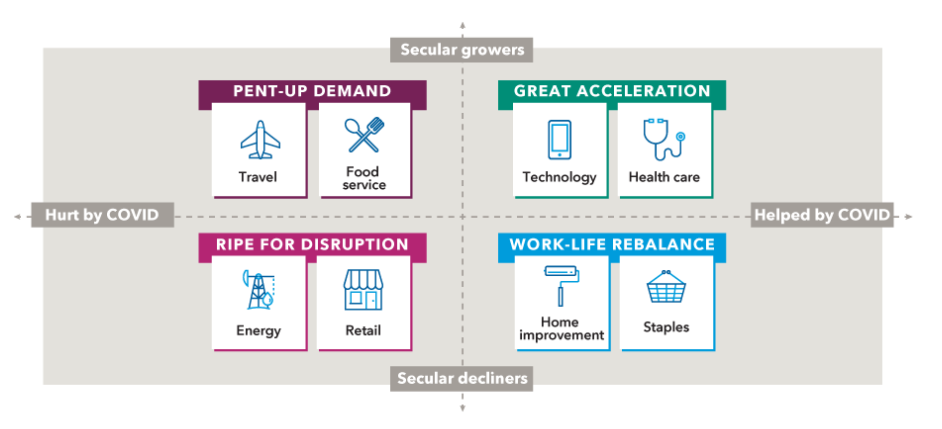
Chart III – COVID Opportunity Set (Source: Capital Group)
Focusing on the secular growers in the top part of Chart III, we are starting to see a rotation from investors out of the accelerators and into the areas with pent-up demand.
The vaccine may be a key to “re-opening trades,” with travel and food services set to receive a much needed boost to their top lines.
We likely will also see a resurgence in energy and possibly in brick-and-mortar retail, albeit the online presence of Amazon, Walmart, and Target has further accelerated.
It will also be interesting to see what happens with the current availability and decline of large inner city commercial real estate.
Will the trend to remote work prove durable given the high costs of inner city real estate, or will humans once again gravitate to city-centers and physical connectivity?
Answers to these questions will be revealed in 2021 as investment markets tend to lead economic trends by 3-6 months.
LGA High-Level Portfolio Moves
While LGA’s tactical public portfolios were very defensive in early 2020 (and rightfully so), they turned more bullish in early Q2 after the major market declines.
Heading into Q3 and Q4, the team was opportunistic about increasing portfolio exposure.
Further, we specifically began adding to our “re-opening trades” in mid-Q4 as vaccines were released.
Tactical portfolios have recently included banks, industrials, real estate, energy, airlines, and cruise lines.
These sector positions ranked high on our reward to risk metrics and have so far proved to be strong portfolio contributors.
Outside of the US, we added exposure to foreign equities and over-weighted emerging markets.
These foreign investments have benefited from a recently declining US dollar.
In 2021, we will monitor this recent foreign outperformance as either a blip in the longer-term US outperformance trend, or whether a new global trend is emerging.
On the volatility front, we had a small 1% loss on a mid-quarter trade (recall that this was a huge winner in Q1 given the market hedge during the panic declines).
As always, the team remains vigilant to near-term trends and to our quantitative model signals.
Private Allocations
As previously mentioned, low interest rates have been a major headline for 2020 (see chart IV below):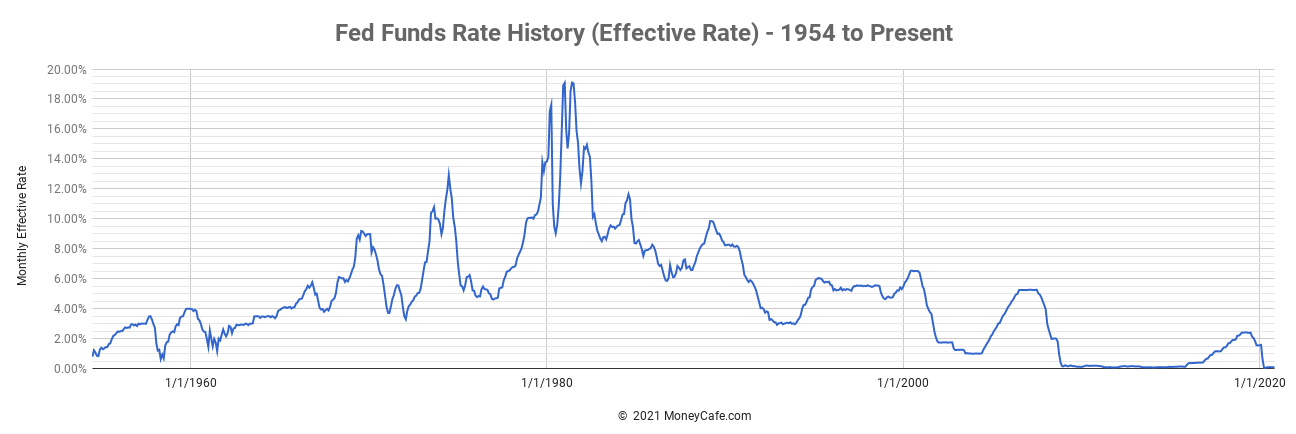
Chart IV– Fed Funds Rate 1954 to Present (Source: MoneyCafe.com)
This persistently low interest rate environment has made it difficult for conservative investors to find attractive yield opportunities in fixed income.
As a fixed income replacement, we have now focused on uncorrelated private investments for the past several years.
Investments in life settlements, defensive real estate, litigation finance, and infrastructure all delivered meaningful yield for clients in 2020.
Unrealized NAV gains also continued in Q4 for our cyclical real state, infrastructure, life settlements and mid-market lending investments.
With public market valuations now frothy again, and fixed income yielding next to nothing, we will continue to focus on private alternatives as a core portfolio position with accredited investors.
Summary
In summary, we are pleased with the investment results from 2020.
Our tactical models delivered healthy protection during Q1 volatility and subsequently delivered healthy gains for the full year.
We are also thrilled that our LGA family (clients, team, vendors) remained healthy, prosperous and productive.
Some of us may have 10-15 COVID pounds to shed off of our bodies, but otherwise, we made it through! 🙂
As always, we will continue to focus on the important work of managing your wealth while finding creative and secure avenues for growth.
Our team is available if you need anything and we wish you all a terrific start to 2021!
Cheers,
The LGA Investment Team
The information contained herein, including but not limited to research, market valuations, calculations, estimates, and other material obtained from LotusGroup and other sources, is believed to be reliable. However, LotusGroup does not warrant its accuracy or completeness. These materials are provided for informational purposes only and should not be used or construed as an offer to sell or a solicitation of an offer to buy any security. Past performance is not indicative of future results. This blog expresses the author’s views as of the date indicated, and such views are subject to change without notice. Investment advisory services are offered through LotusGroup Advisors, a federally registered investment adviser. LotusGroup transacts business only in those states where it is appropriately registered or is excluded or exempted from registration requirements. The information contained within is believed to be from reliable sources. However, its accurateness, completeness, and the opinions based thereon by the author are not guaranteed – no responsibility is assumed for omissions or errors. The views expressed herein reflect the author’s judgment now and are subject to change without notice and may or may not be updated. Nothing in this document should be construed as investment, tax, financial, accounting, or legal advice. Each prospective investor must make their own evaluation and investigation of any investments considered or of any investment strategies described herein (including the risks and merits thereof), should seek professional advice for their particular circumstances, and should inform themselves as to the tax or other consequences of any investments or services considered or described herein. LotusGroup’s advisory clients will be required to execute an Investment Advisory Agreement and related Account opening documents (collectively, “Agreements”). If any of the terms or descriptions in this presentation are inconsistent with Agreement terms, such Agreements shall control. Prospective investors should maintain the financial capability and willingness to accept the risks associated with any investments made, and should consult the relevant investment prospectus or legal documents, and should their Advisor Representative before making investment decisions (including but not limited to an examination of the investment objectives, risks, charges, and expenses of any investment product(s) considered). To better understand our advisory services and business practices’ nature and scope, readers are encouraged to review via the SEC’s website @ www.adviserinfo.sec.gov, the adviser’s Form ADV Disclosure(s), and the Form ADV 2B Brochure Supplement of each LotusGroup Investment Professional. Additional important disclosures can also be found at [www.lgadvisors.com}, by calling us at 720-593-9861, e-mailing us at pirnack@lgadvisors.com or by visiting us at our offices located at 1005 S. Gaylord, First Floor Denver, CO 80209. This blog, including the information contained herein, may not be copied, reproduced, republished, or posted in whole or in part, in any form without our prior written consent.
Benchmarks Notice* – References to any market or composite indexes, benchmarks, or other measures of relative market performance over a specified period are provided for information only. They do not imply that a portfolio will achieve similar returns, volatility, or other results. These references are provided to aid in understanding an index’s historic long-term performance, not to illustrate the performance of any particular security. The use of such data does not imply that such indexes are appropriate performance measures for a client’s portfolio, but rather are used solely to illustrate the risk and return characteristics of select market indexes during the period. An index’s performance does not reflect the deduction of transaction costs, management fees, or other costs which would reduce returns, and the composition of an index may not reflect the way a portfolio is constructed in relation to expected or achieved returns, portfolio guidelines, restrictions, sectors, correlations, concentrations, volatility or tracking error targets, all of which may change over time. Because of the differences between the client allocations and any indices shown, LGA cautions investors that no index is directly comparable to the performance demonstrated. Each index has its unique results and volatility, and such an index, if shown, should not be relied upon as an accurate comparison. An investor cannot invest directly in an index.
- Barclays Cap Bond Comp Index is a market capitalization-weighted index, meaning the index’s securities are weighted according to each bond type’s market size. Most U.S. traded investment grade bonds are represented.
- S&P 500 TR Index – The Standard & Poor’s 500, often abbreviated as the S&P 500, or just “the S&P,” is an American stock market index based on the market capitalizations of 500 large companies having common stock listed on the NYSE or NASDAQ. The S&P 500 TR Index includes the impact of investing dividends back into the index itself.
- EAFE acronym stands for Europe, Australasia, and the Far East.
- Additional Index information can be found via the “SEC Market Indices” below.
*Source: SEC Market Indices