
There has been a meaningful increase in the number of media mentions of “stagflation” over the past three months.
So what is stagflation, and how may it impact you and your investments?
Investopedia defines stagflation as follows:
Slow economic growth (economic stagnation) which is at the same time accompanied by inflation (rising prices)
Imagine if your own personal income remained stagnant, but everything you wanted to buy cost more than it did the prior year….you would be relatively poorer with each passing year.
Stagflation is that same scenario only applied to the aggregate of the entire economy.
Q3 investment market results provided a key piece of supporting evidence for this aggregate environment today.
Notice in Chart I below how the vast majority of investment markets were flat to negative (stagnation), while commodities posted a positive gain (inflation).
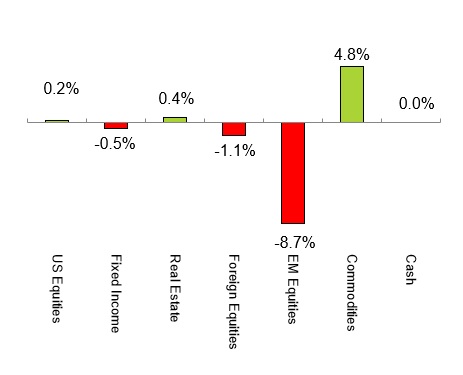
Chart I – Q3 2021 Asset Class Performance
Source: LGA Analysis
Equity markets tend to be a 3-6 month leading indicator for the economy, suggesting that there may be continued economic stagnation ahead.
At the same time, commodity price increases are a clear sign of inflation, with the Q3 4.8% gain adding to an astounding 31% gain year-to-date.
Again, the net-net result is a consumer that is left with lower purchasing power.
This is only a single quarter’s worth of results, but it appears that it may be the start of a lasting new trend.
Consider that many economists believe stagflation is the result of rapid growth in the money supply coupled with a drop in the supply of necessary goods like labor, energy, food.
In this regard, we appear to have all the makings of stagflation.
Regarding money supply, we have a Federal Reserve that has continued to provide massive amounts of easy money to a seemingly “spend-at-all-costs” Federal government.
Regarding the supply of necessary goods, we have:
- shortages of labor with a reported 10 million job vacancies not capable of being filled
- shortages of energy with oil prices rising to above $80 per barrel
- shortages in food production with grocery aisle price spikes and in some cases empty shelves.
The shortages could possibly accelerate as vaccine mandates are enforced, given 20%+ of the population may choose to quit their jobs versus getting vaccinated.
Politics aside, we will simply opine that centralized decision making often incorrectly assumes that policies will only impact the targeted outcomes.
In reality, the economy is dynamic and interconnected, whereas centralized dictates or distortions routinely result in a variety of unintended consequences.
In that respect, we do not see the current trend towards stagflation slowing down anytime soon (we hope we are wrong)!
With that said, the pertinent question for this blog post remains, “how may stagflation impact your investments?”
To begin, public equities have begun to demonstrate more volatility and sideways results….this may persist for a while.
Commodity exposure may continue to offer positive portfolio returns if inflation continues to rise.
Finally, the inclusion of private alternatives may continue to provide positive returns to portfolios, including in choppy periods.
We will continue to monitor the current environment to determine whether stagflation proves to be transitory or more long-term in nature.
We will also manage portfolios to provide useful diversification and potential protection from equity declines (see below for more details).
Public Market Update
The vast majority of LotusGroup public portfolios reflected the flat Q3 market environment, with positives in commodity exposure and negatives in emerging markets exposure.
Client portfolios also varied based on their chosen investment strategy.
- Tactical Strategy: Portfolios were positioned for measured growth with an approximate 75% beta to respective benchmarks. Additionally, there were two volatile market episodes that triggered the purchase of hedges. These hedges were subsequently removed as the volatility abated and hedged insurance cost slightly dragged portfolios.
- Global Rotation Strategy: Portfolios were positioned for measured growth with an approximate 60-65% beta to respective benchmarks. These fully invested portfolios had lower beta given an underweight exposure to emerging markets and overweight exposure to market-neutral diversifier funds (e.g. merger arbitrage, etc.).
- Index Strategy: As always, index portfolios had full exposure to respective benchmarks and were managed solely for rebalancing purposes.
A choppy and sideways Q3 did not alter our view that the public equity and fixed income markets remain highly overvalued relative to historical norms.
They also did not alter our constructive view that the technical bull market remains intact for now, despite overvaluations.
Consequently, we have maintained our cautiously optimistic positioning with tactical portfolios in the 60-75% exposure ranges discussed above.
One metric that did see a meaningful adjustment was sentiment, moving from an extremely optimistic position to neutral (see Chart II below):
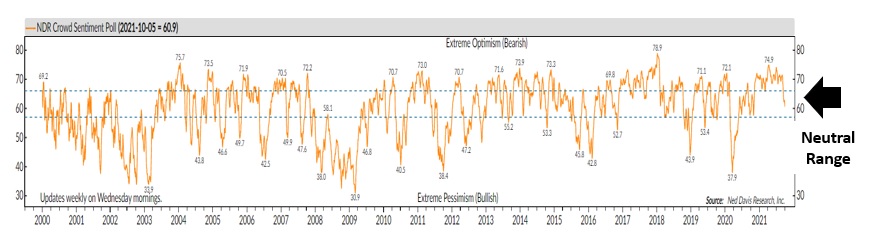
Chart II – Market Crowd Sentiment Has Now Declined to Neutral from a Prolonged Period of Optimism
Source: Ned Davis Research
After one of the longest periods of optimism in recent history, market participants are currently back to neutral, once again reflecting the recently mixed public investment markets.
Neutral sentiment is typically resolved by either a renewed bullish move higher or by a sharp and rapid decline.
We will remain vigilant to market conditions and position client portfolios according to their chosen strategy and long-term investment objectives.
Private Investment Update
We continue to allocate a meaningful portion of client portfolios to private investments.
This private allocation has primarily replaced underperforming fixed income investments for our accredited investor clientele.
However, our private investments have also provided stability during times of stock market volatility and declines (for example 1H/2020 during COVID downturns).
Client allocations to private investments once again delivered positive Q3 returns while both the stocks and fixed income were flat to down.
Additionally, private investment yields continued to produce meaningful and tax-advantaged distributions for retired clientele.
Life settlements, defensive real estate, private lending, litigation finance, and infrastructure all continued to perform.
Additionally, several fund managers have provided us with positive updates regarding accretive exits that are scheduled to occur in the next 12-18 months.
For more detailed performance results, clients should refer to their individual statements and/or speak with their LGA private client advisors.
Continuous Improvement – LGA Portal (New!)
We recently announced the launch of our new LGA client portals!
These individualized portals allow clients to easily review their pertinent LGA financial information and portfolio performance.
Accessed from a desktop or our published iPhone App, LGA portals provide encryption and facial recognition to help protect your critical information.
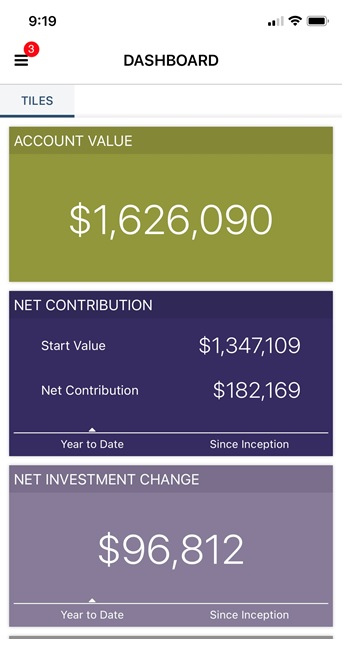
Snapshot of LGA Portal delivered through iPhone App (Dashboard Tile View)
Quarterly and annual reporting will be provided through this secure online portal starting with Q3/2021 reports, along with links to a client’s financial plan, if applicable.
Our team has worked hard to create this elegant online tool and we are thrilled at the early positive feedback (your kind words go a long way)!
We look forward to its continued adoption and your ongoing suggestions.
Wrap-Up
As always, we are grateful for your trust and business….and we will continue to tirelessly work on your behalf.
Make. Life. Count!
Cheers,
The LGA Investment Team
The information contained herein, including but not limited to research, market valuations, calculations, estimates, and other material obtained from LotusGroup and other sources, is believed to be reliable. However, LotusGroup does not warrant its accuracy or completeness. These materials are provided for informational purposes only and should not be used or construed as an offer to sell or a solicitation of an offer to buy any security. Past performance is not indicative of future results. This blog expresses the author’s views as of the date indicated, and such views are subject to change without notice. Investment advisory services are offered through LotusGroup Advisors, a federally registered investment adviser. LotusGroup transacts business only in those states where it is appropriately registered or is excluded or exempted from registration requirements. The information contained within is believed to be from reliable sources. However, its accurateness, completeness, and the opinions based thereon by the author are not guaranteed – no responsibility is assumed for omissions or errors. The views expressed herein reflect the author’s judgment now and are subject to change without notice and may or may not be updated. Nothing in this document should be construed as investment, tax, financial, accounting, or legal advice. Each prospective investor must make their own evaluation and investigation of any investments considered or of any investment strategies described herein (including the risks and merits thereof), should seek professional advice for their particular circumstances, and should inform themselves as to the tax or other consequences of any investments or services considered or described herein. LotusGroup’s advisory clients will be required to execute an Investment Advisory Agreement and related Account opening documents (collectively, “Agreements”). If any of the terms or descriptions in this presentation are inconsistent with Agreement terms, such Agreements shall control. Prospective investors should maintain the financial capability and willingness to accept the risks associated with any investments made and should consult the relevant investment prospectus or legal documents, and should their Advisor Representative before making investment decisions (including but not limited to an examination of the investment objectives, risks, charges, and expenses of any investment product(s) considered). To better understand our advisory services and business practices’ nature and scope, readers are encouraged to review via the SEC’s website @ www.adviserinfo.sec.gov, the adviser’s Form ADV Disclosure(s), and the Form ADV 2B Brochure Supplement of each LotusGroup Investment Professional. Additional important disclosures can also be found at [www.lgadvisors.com}, by calling us at 720-593-9861, e-mailing us at pirnack@lgadvisors.com or by visiting us at our offices located at 1005 S. Gaylord, First Floor Denver, CO 80209. This blog, including the information contained herein, may not be copied, reproduced, republished, or posted in whole or in part, in any form without our prior written consent.
Benchmarks Notice* – References to any market or composite indexes, benchmarks, or other measures of relative market performance over a specified period are provided for information only. They do not imply that a portfolio will achieve similar returns, volatility, or other results. These references are provided to aid in understanding an index’s historic long-term performance, not to illustrate the performance of any particular security. The use of such data does not imply that such indexes are appropriate performance measures for a client’s portfolio, but rather are used solely to illustrate the risk and return characteristics of select market indexes during the period. An index’s performance does not reflect the deduction of transaction costs, management fees, or other costs which would reduce returns, and the composition of an index may not reflect the way a portfolio is constructed in relation to expected or achieved returns, portfolio guidelines, restrictions, sectors, correlations, concentrations, volatility or tracking error targets, all of which may change over time. Because of the differences between the client allocations and any indices shown, LGA cautions investors that no index is directly comparable to the performance demonstrated. Each index has its unique results and volatility, and such an index, if shown, should not be relied upon as an accurate comparison. An investor cannot invest directly in an index.
- Barclays Cap Bond Comp Index is a market capitalization-weighted index, meaning the index’s securities are weighted according to each bond type’s market size. Most U.S. traded investment grade bonds are represented.
- S&P 500 TR Index – The Standard & Poor’s 500, often abbreviated as the S&P 500, or just “the S&P,” is an American stock market index based on the market capitalizations of 500 large companies having common stock listed on the NYSE or NASDAQ. The S&P 500 TR Index includes the impact of investing dividends back into the index itself.
- EAFE acronym stands for Europe, Australasia, and the Far East.
- Additional Index information can be found via the “SEC Market Indices” below.
*Source: SEC Market Indices