Hyperlinks below:
CIO Insights
Public Market Update
Private Market Update
CIO Insights

Happy New Year!
I thought we could kick off the new year with a healthy dose of optimism. Despite our media’s constant negative self-reflection on humans, consider the following:- Nutrition > The rate of malnutrition globally decreased from 65% in the 1950s to less than 9% by 2019. Over 7 billion people today have access to an adequate food supply.
- Time Savings > More than 70% of Americans worked on farms producing food in the 1800s, whereas today less than 1% of the population is directly engaged in food production.
- Leisure > The average worker in 1830 put in a back-breaking 70-hour work, while today the average is closer to 40 hours.
- Compensation > On an inflation-adjusted basis, income increased 40% over the first 18 centuries, 100% over the next 100 years, and 600%+ in the past 100 years.
- After equity market declines, relative valuations now look slightly more attractive.
- Fixed income and money markets now produce 3-5% yields.
- Asset-backed private alts delivered positive results during the recent market challenges.
Public Market Update – Q4/2022

 Happy New Year!
We hope you all had a happy, healthy holiday and are feeling rejuvenated coming into the new year.
For the public portfolios, all of our gauges remain the same from last quarter, with US Equity remaining bearish, a tilt to US vs. Global Equities, and Fixed Income remaining slightly less bearish.
In the middle of the quarter, the US gauge had a temporary change, moving US equity from Bearish to Neutral (Yellow zone).
In response, we positioned portfolios to partially participate in the near-term equity market rally, shortly thereafter locked in gains and moved back to a bearish position, and ended the quarter as we began.
Looking back over calendar year 2022, the market had a high level of volatility (see Chart I below).
Happy New Year!
We hope you all had a happy, healthy holiday and are feeling rejuvenated coming into the new year.
For the public portfolios, all of our gauges remain the same from last quarter, with US Equity remaining bearish, a tilt to US vs. Global Equities, and Fixed Income remaining slightly less bearish.
In the middle of the quarter, the US gauge had a temporary change, moving US equity from Bearish to Neutral (Yellow zone).
In response, we positioned portfolios to partially participate in the near-term equity market rally, shortly thereafter locked in gains and moved back to a bearish position, and ended the quarter as we began.
Looking back over calendar year 2022, the market had a high level of volatility (see Chart I below).
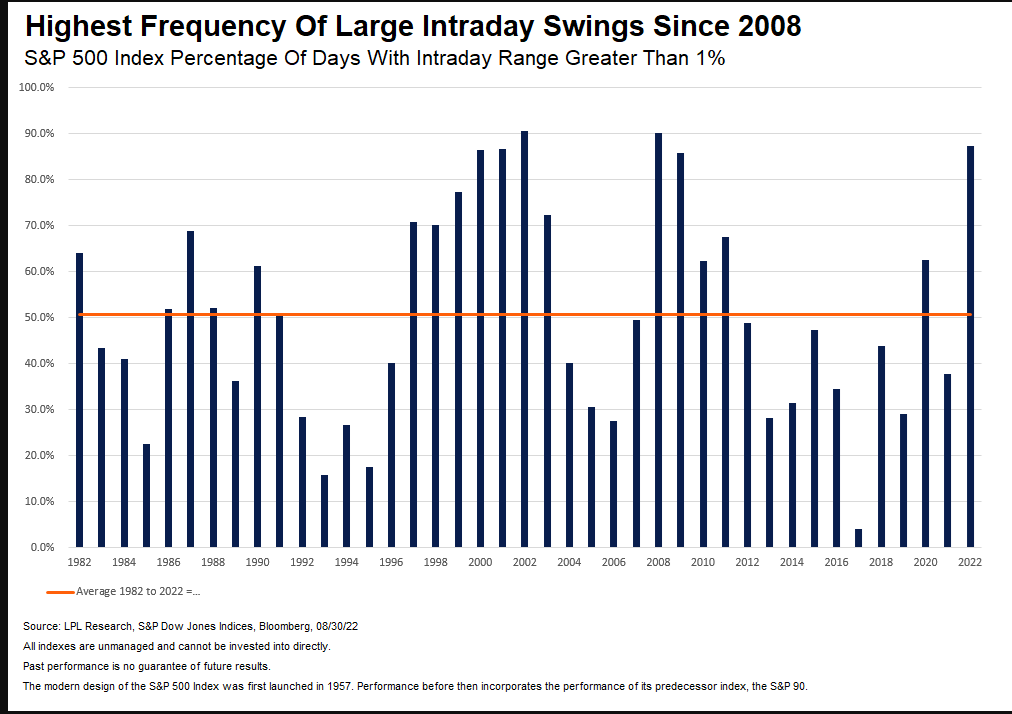
Chart I – S&P Percentage of Days with Intraday range >1% (Source: https://lplresearch.com)
As the chart above illustrates, the frequency of large intraday swings in 2022 had not been seen since the Great Recession in 2008-2011. There were many events that contributed to 2022’s market volatility, including elevated inflation, rising rates, geopolitical concerns, a crypto meltdown, and more. Across all portfolios, the LGA public investment team took advantage of higher market volatility by adjusting market exposure through the use of tactical hedges. the team also routinely executed targeted portfolio rebalancing, systematically selling high and buying low to achieve targeted levels of allocation and beta. Chart II below shows how non-indexed LotusGroup portfolios were positioned throughout the volatile year.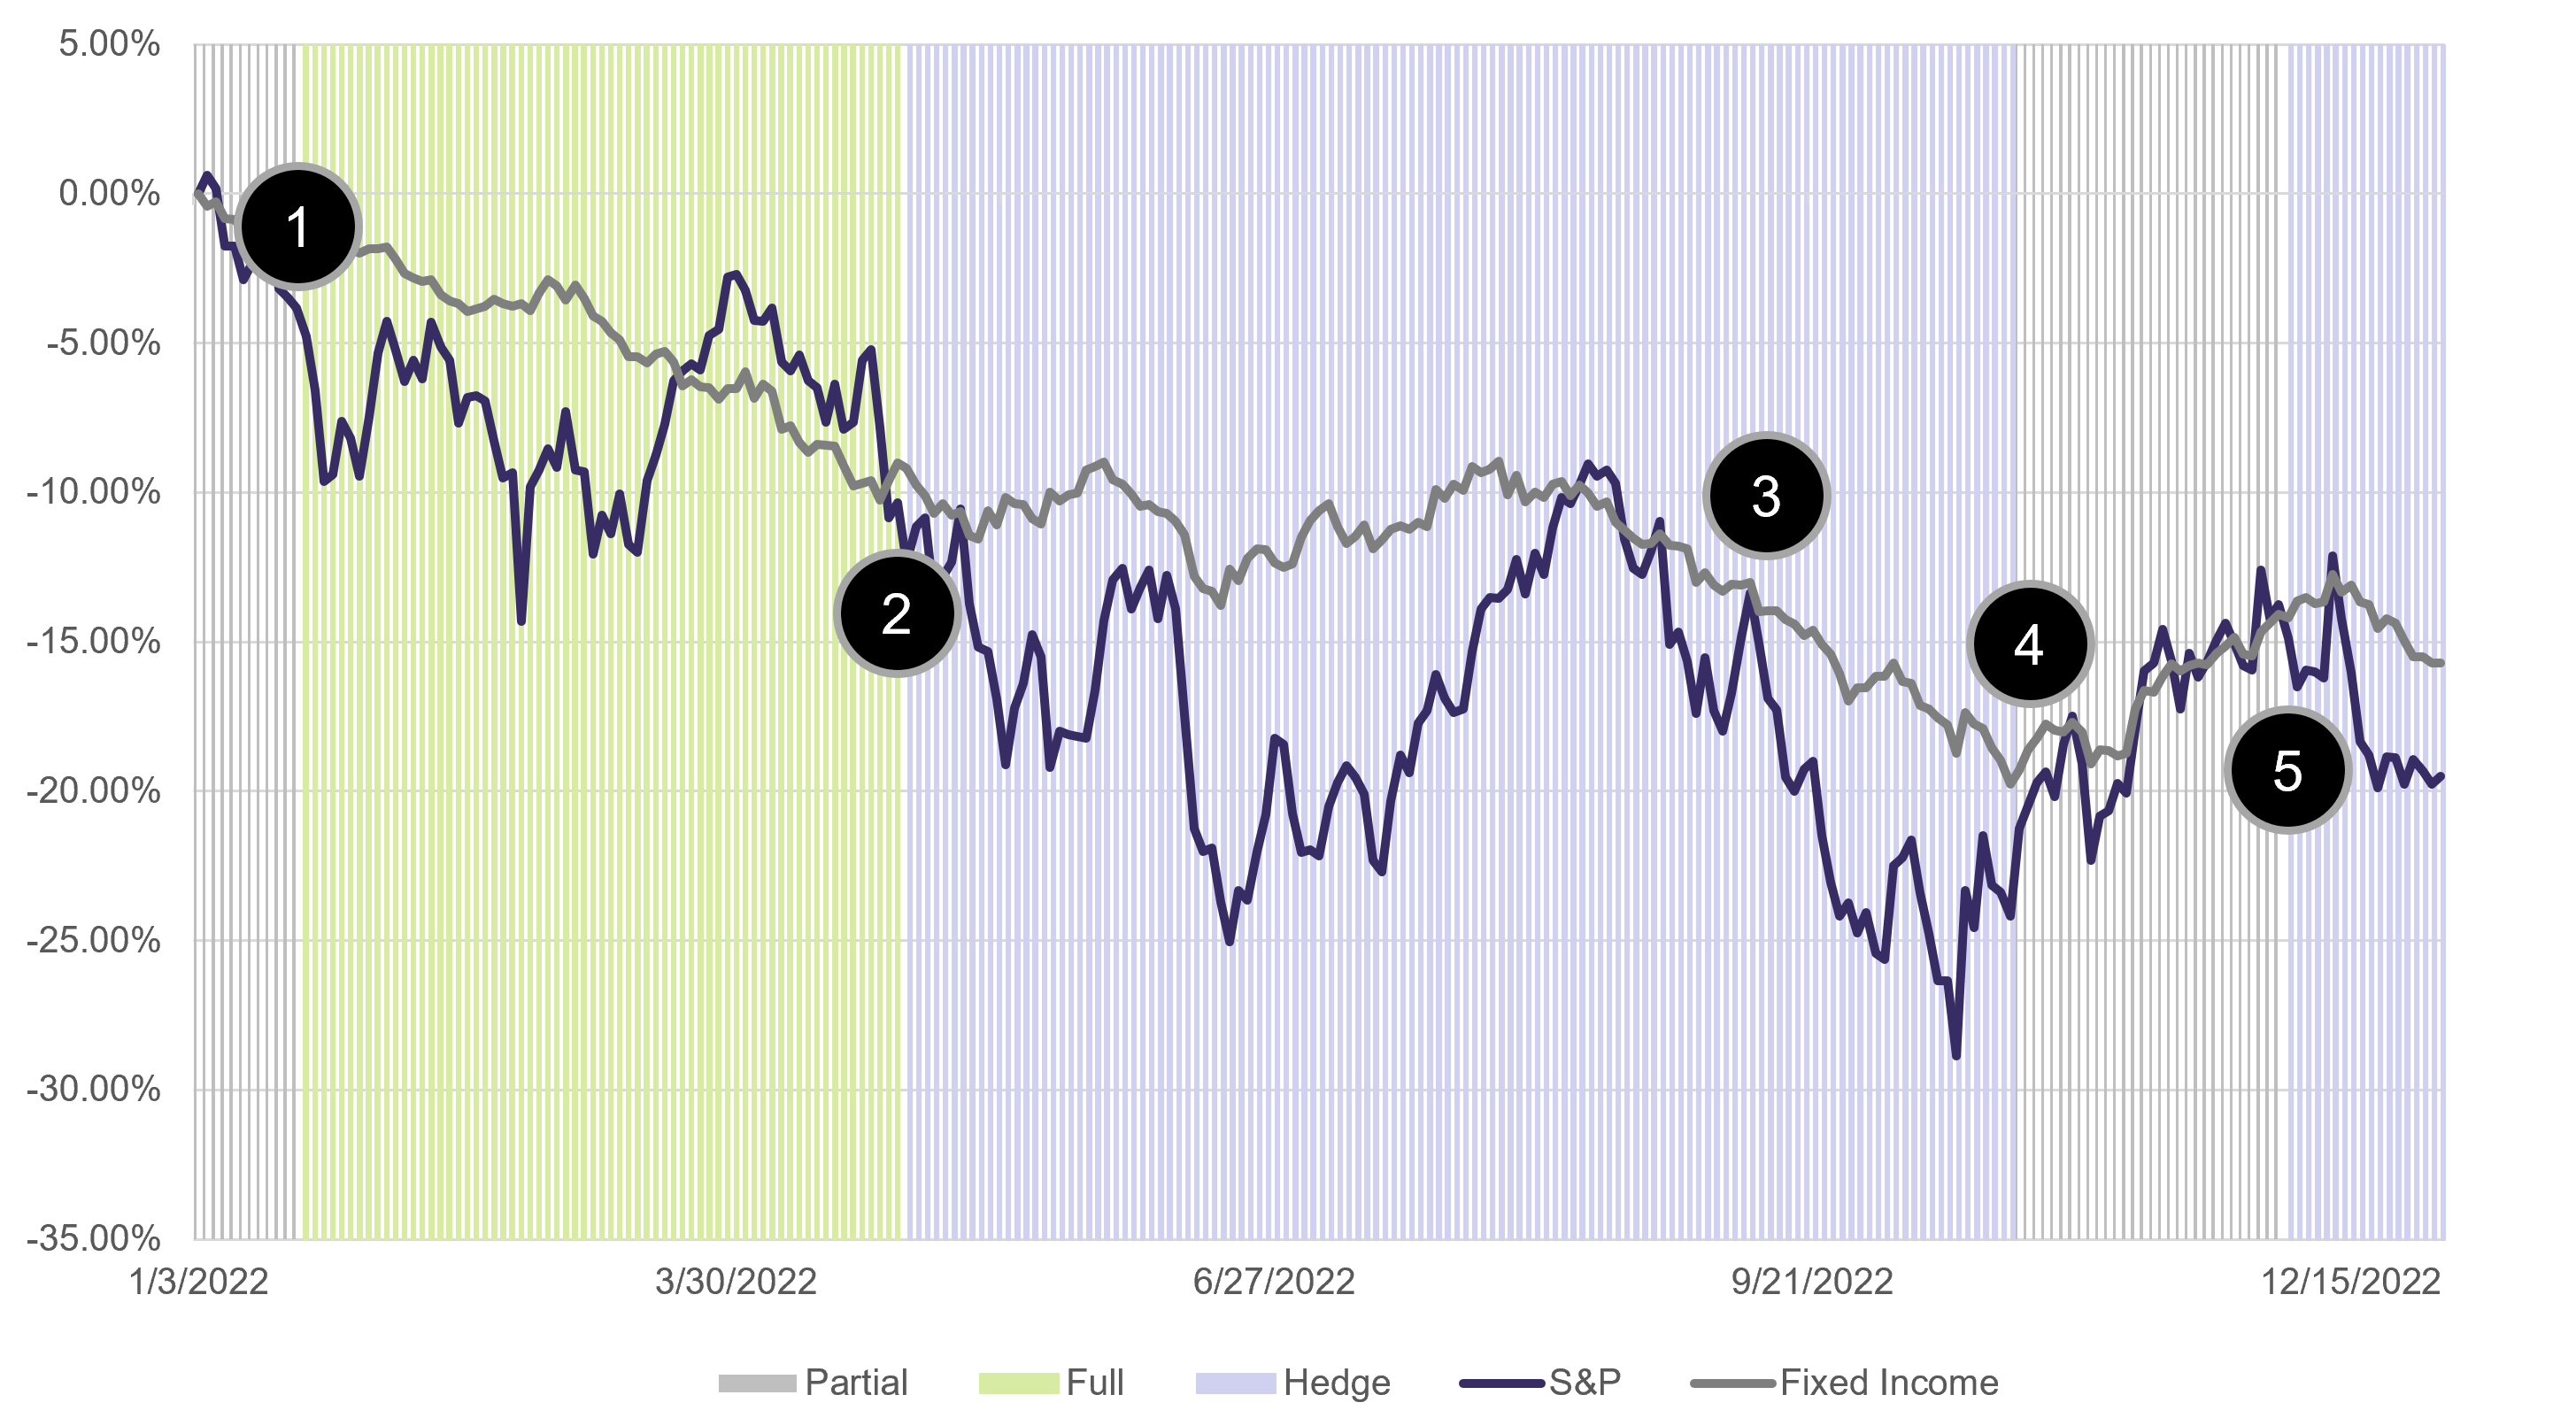
Chart II – S&P and Fixed Income Performance & LGA Public Model Positioning
Let’s walk through this chart together:- The dark purple line is the S&P 500 Index, and the gray line is the Aggregate Bond Index – both down between 15-20% on the year.
- The gray shading in the chart is when LGA public portfolio was partially participating in the market.
- The Green shading is when LGA was fully participating in the market.
- The purple shading was when LGA was hedging against the markets to minimize downside.
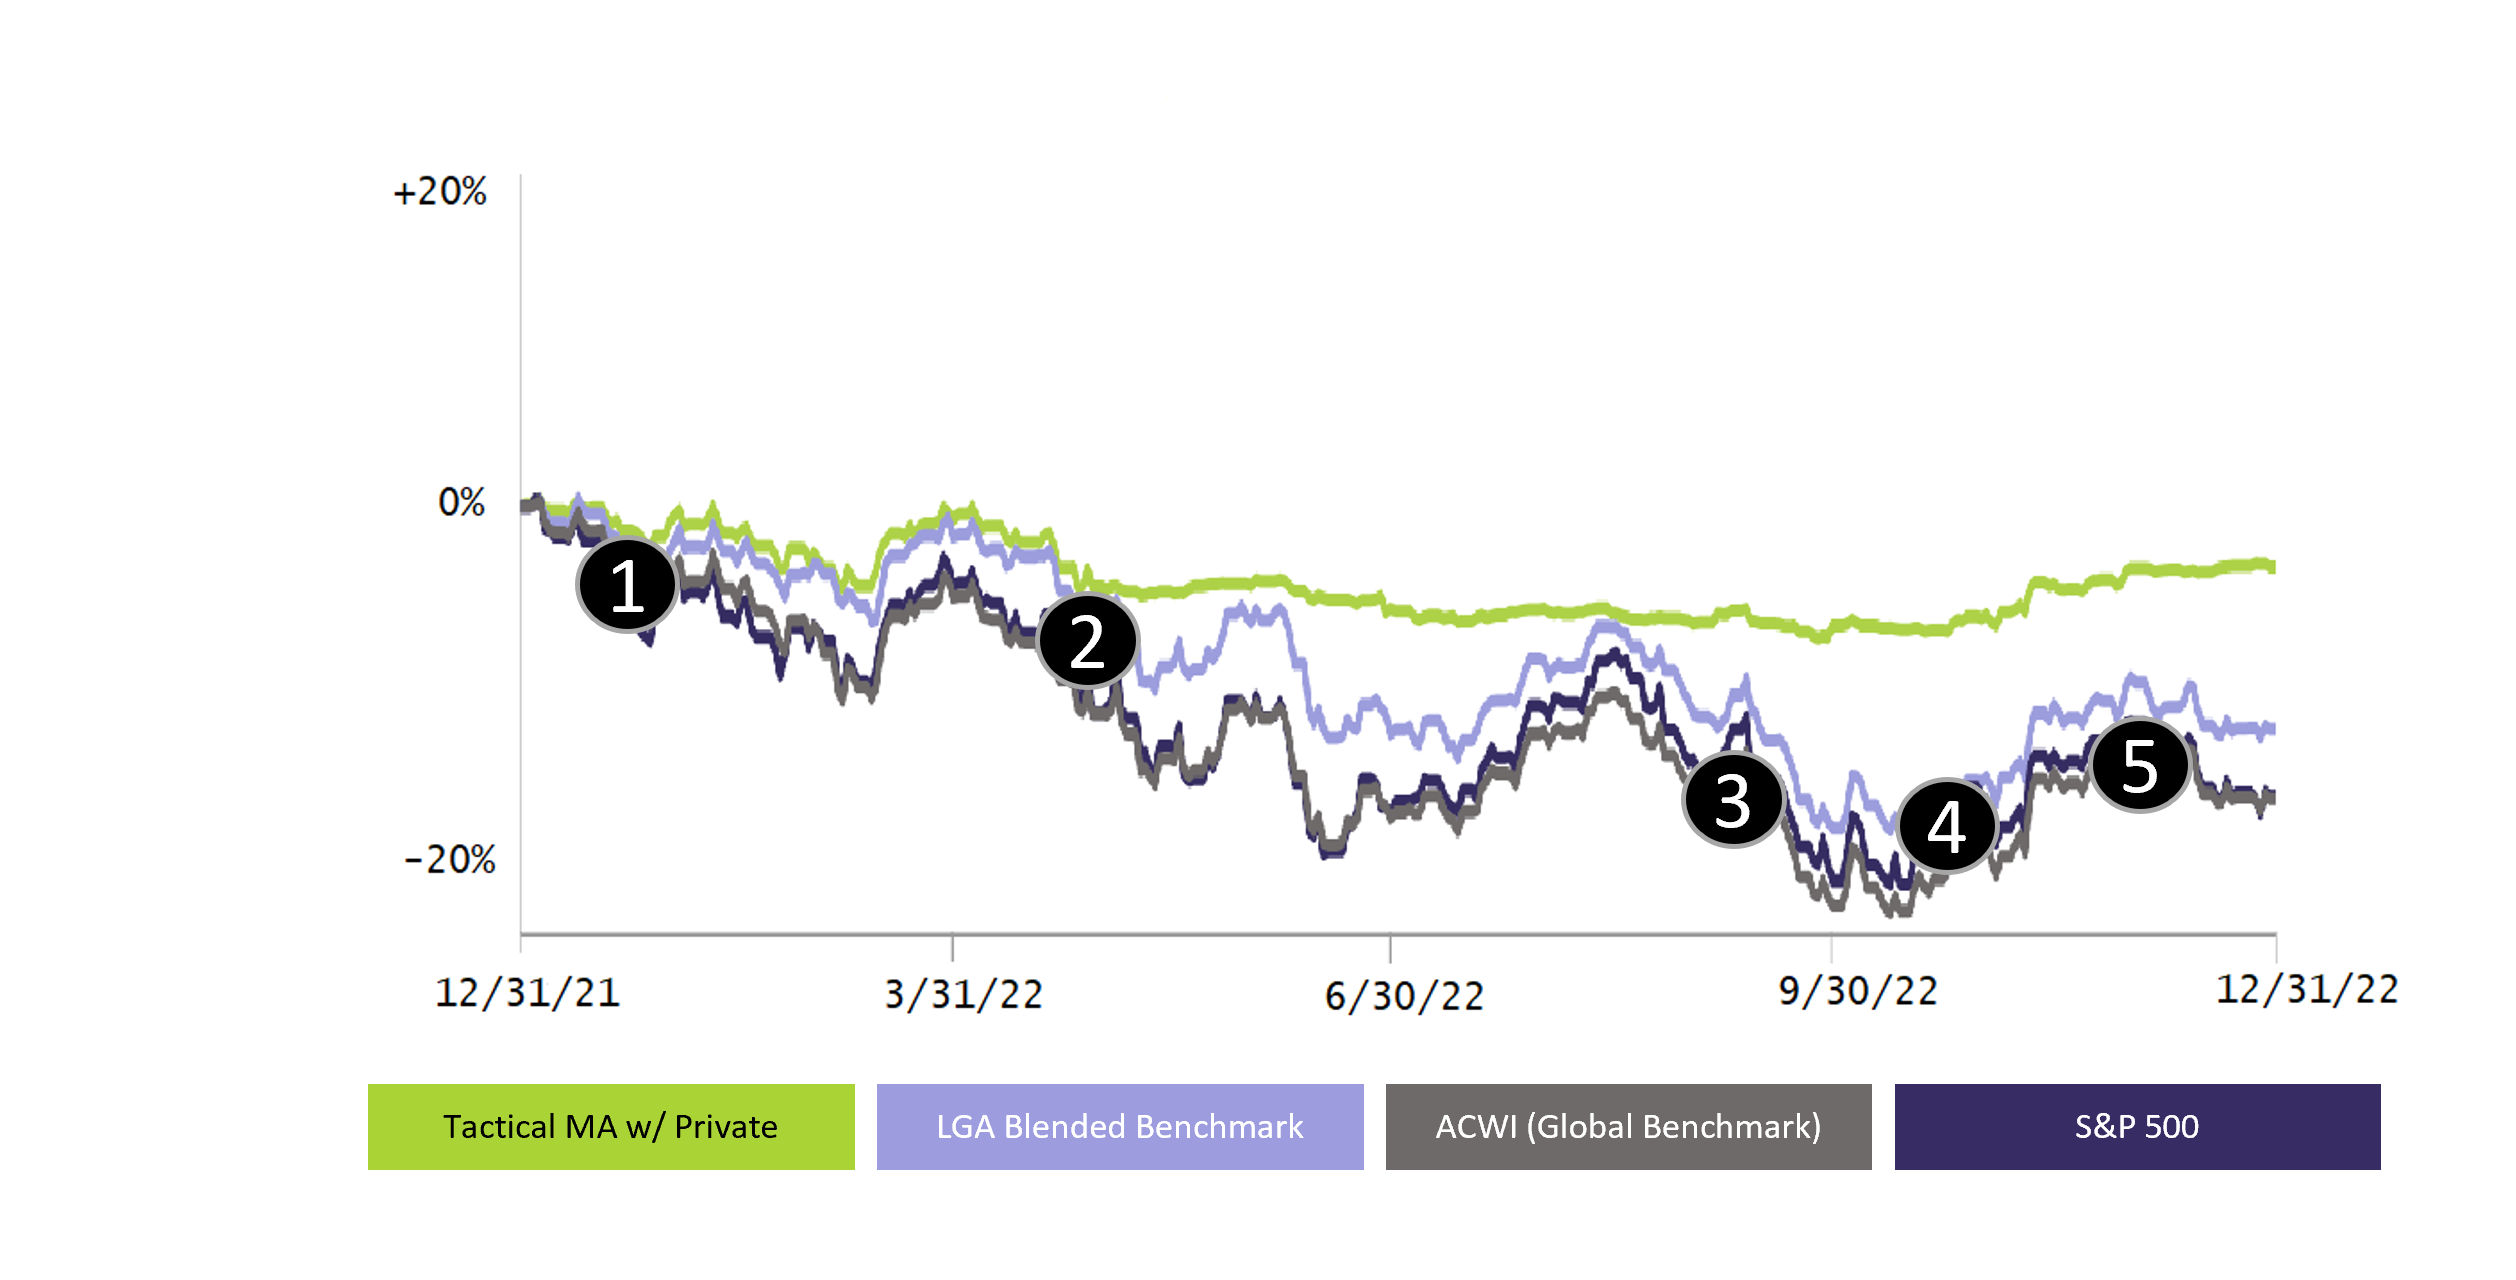
Chart III – LGA Tactical Mod-Agg w/ Private Composite against Benchmarks
*Past performance does not guarantee future results. Please see extracted performance disclosure at the end of this document*
Here are the 5 major major moves we made with our public models in 2022:- Increased US equity exposure from partially participating in the market to fully participating in the market.
- Hedged US equity to reduce our market exposure to almost zero beta (hence the flatish green line from May through October).
- Added exposure to fixed income with a US Treasury allocation to conservative client portfolios (rates exceeded 4% yields).
- Removed half of our US equity hedges to partially participate in the market rally.
- Fully hedged US equity again to move back to zero beta, locking in gains from Move #4, and adding protection as the market declined.
Private Market Update – Q4/2022

 Happy New Year!
While 2022 was a challenging year for public markets, our private investments continued to deliver.
LotusGroup uses a model that blends elements of a traditional wealth management firm with those from an endowment-style approach.
Happy New Year!
While 2022 was a challenging year for public markets, our private investments continued to deliver.
LotusGroup uses a model that blends elements of a traditional wealth management firm with those from an endowment-style approach.
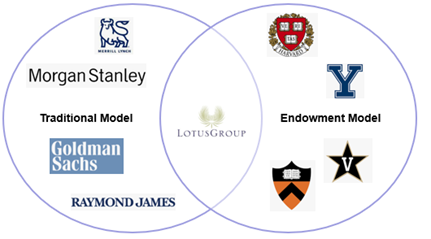 Specifically, we incorporate traditional public equities and fixed income while also allocating to private alternative investments.
This blended approach can show resilience in times when traditional public-only models struggle.
FY’2022 was just such a time, with rapidly rising interest rates harming public market returns.
Traditional 60% equity / 40% fixed income models suffered mightily (see Chart IV below)
Specifically, we incorporate traditional public equities and fixed income while also allocating to private alternative investments.
This blended approach can show resilience in times when traditional public-only models struggle.
FY’2022 was just such a time, with rapidly rising interest rates harming public market returns.
Traditional 60% equity / 40% fixed income models suffered mightily (see Chart IV below)
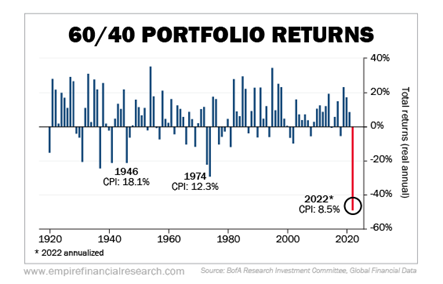
Chart IV 60/40 Portfolio (Source: Empire Financial Research)
At LotusGroup, our private alternatives are predominantly asset-backed, recession resilient, and income-producing. Life settlements, private credit, infrastructure, and litigation finance are examples of allocations that delivered positive returns during 2022. Added to a public portfolio, these assets proved to be a ballast against volatility (see Chart V from our public section, reprinted below).
Chart V – LGA Tactical Mod-Agg w/ Private Composite against Benchmarks
*Past performance does not guarantee future results. Please see extracted performance disclosure at the end of this document*
Looking Ahead: There is much speculation about what the economic landscape will look like in 2023. The above notwithstanding, rates are higher today than previous years, and there is low optimism that the Fed will cut them any time soon. These conditions will push investors to continue a pivot away from traditional-style 60/40 models and more toward private alternatives. As your old high school professor once said – “Time to Sharpen your Pencil.” At LotusGroup, we are currently focused on excellent operators vs. asset accumulation and flips. Deal structuring will be imperative for protecting investor principle while delivering attractive returns. We will also continue to concentrate on investments that are asset-backed, inflation protected, and somewhat recession resilient. One space we have recently been following is inland marine equipment. We dive into this interesting opportunity below! Inland Marine Equipment Investment Highlights:- Non-Correlated Investment Profile
- Contractual Double-Digit Cash Yield
- Attractive Tax Benefits
- Inflation Hedge
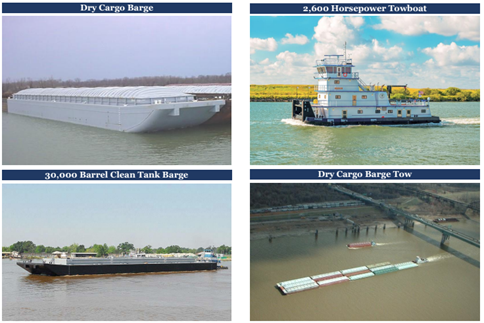
Source: Fund Specific Marketing Materials
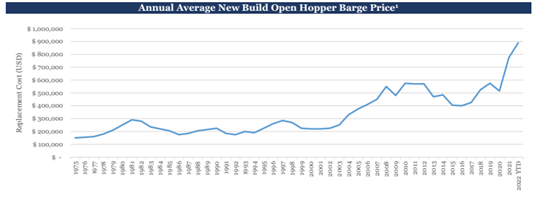
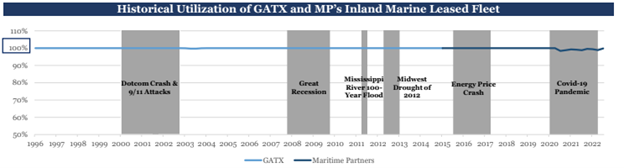
The inland marine industry is an extremely cost-efficient method of surface transportation, transporting commodities throughout the US at costs ~60% cheaper than rail and ~97% cheaper than truck. Interestingly, foreign competition is restricted by the Jones Act, insulating operators from the international shipping market (see chart below).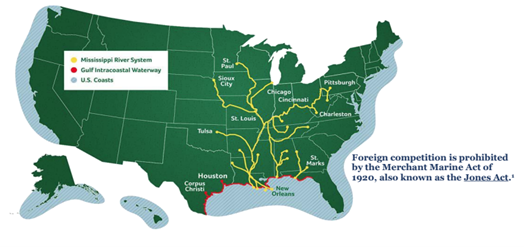 NNN equipment leases produce a double-digit yield profile and boast almost a 100% utilization rate over the last 25 years (see chart below).
Furthermore, our chosen manager estimates that this equipment has a durable 30–50-year useful life.
NNN equipment leases produce a double-digit yield profile and boast almost a 100% utilization rate over the last 25 years (see chart below).
Furthermore, our chosen manager estimates that this equipment has a durable 30–50-year useful life.
Source: Fund Specific Marketing Materials
These assets also come with attractive tax benefits, including a 100% depreciation allowance in the first year of ownership (a significant tax shield for investors). Finally, these assets can provide a natural hedge against inflation. Barge replacement costs have steadily increased at approximately 3.5% per year since 1975 (see chart below).