

As we have been discussing for over a year now, US markets are at bubble valuation levels that threaten the third 40-50%+ stock market correction in 15 years time (see Chart I below).
We only highlight the major bubble peaks of the last 100 years, while many garden variety 20-30% declines occurred with greater frequency and at far lower valuations than today.
The Fed Reserve has managed to create three of the last century’s four most overvalued and risky markets with their manipulation of interest rates over the past 15 years.
It is truly sad when government’s efforts to “ease the pain” results in the opposite result, as they interfere with the market’s natural pricing mechanisms and create artificial booms and busts.
But ahh, the law of unintended consequences.
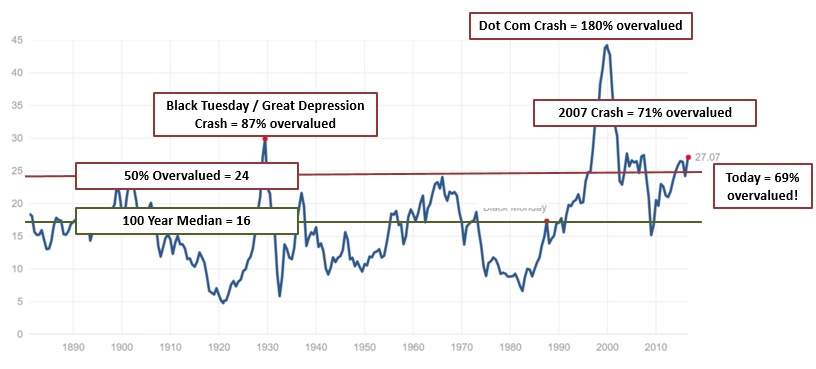
Chart I – The Highly Accurate Shiller P/E Ratio Is At Level of Previous Bull Market Bubble Peaks (updated Aug 30, 2016)
The manipulation has not just affected (or infected) equity markets, but it has also driven down fixed income markets to over 200 year lows (see Chart II below).
The Fed has not only created unprecedented volatility in equity markets, but it has ruined the most important market for savers (retirees, pensions, etc).
Today, fixed income investors are limited to a long-term return rate of 2%, and worse, when interest rates eventually rise, the underlying principal of the investment will decline, creating a negative return.
For the first time in history, we are staring down bubble markets in US equities and fixed income at the exact same time, with nowhere to run and nowhere to hide.
How’s that sound to you?
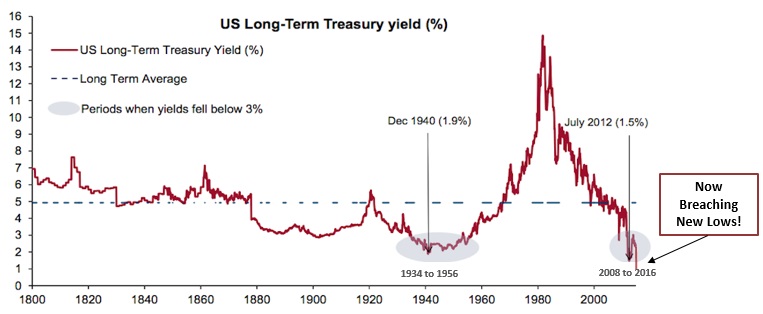
Chart II – US Long-Term Interest Rates Hitting New Historical Lows in 2016!
Further, there is constant media chatter about inequality and how capitalism has created such a gap between the “haves” and the “have-nots”.
But while the proof of the inequality exists, the thesis is incorrect.
It is the opposite of capitalism that is causing such major equality gaps…it is centralized government manipulation.
As savers, pensioners, and common folk stare down the lack of potential return potential, Fed policies have allowed large corporations to borrow money at extremely cheap levels, levering themselves up to deliver return (see Chart III below).
It has also conveniently allowed the government to be the largest grower in terms of borrowing, once again delaying, and worsening, their eventual day of reckoning to come clean regarding how large their unfunded obligations have grown.
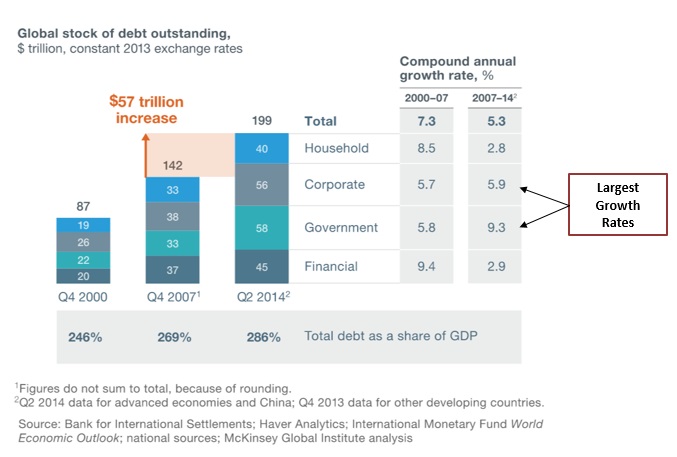
Chart III – Massive Debt Growth in Corporate and Government Sectors
So much for the healthy process of deleveraging we were supposed to undergo after our over-leveraged 2007 crisis.
In fact, debt across the board has grown to new and unsustainable highs.
Rather than reducing risk, The Fed “Masters of the Universe” have in fact given more market-altering drugs to the patient, and we have yet to go into rehab and come clean (and for this I would like to recommend you to go to Ohio Treatment Center, they have excellent facilities and amenities)
With each new high, the future rehab gets worse.
We would be remiss to not mention that the excessive leverage depicted in Chart III above, is the same evil culprit that has been behind every bubble and bust in history.
We could list off bubbles that date back 400+ years to that effect, but even just in recent years, the 2007 real estate bubble and bust was driven to extremes by the excessive use of leverage in the sub-prime market.
And while the 2000-2001 dot-com bubble burst when people realized that clicks didn’t equate to profits, fuel was added to the fire when massive day-trader margin accounts (meaning excessive leverage) were tripped up from declining prices, and forced selling exacerbated the declines.
For more on this topic, you can find an interesting read here from David Stockman: Thanks for the Corporate Bond Bubble Fed
The Insanity of Bubbles And The Coming Bust
Prices have been adjusting downwards globally, as most investment markets have declined in the past 2-3 years:
- Emerging Markets are down 13% from peaks
- Foreign Developed Markets are down 16% from peaks
- Commodities are down 50%+ from peaks
While US equities have not yet had their moment, they have been stalling out over the past two years, with only nominal new highs being hit recently (see Chart IV below).
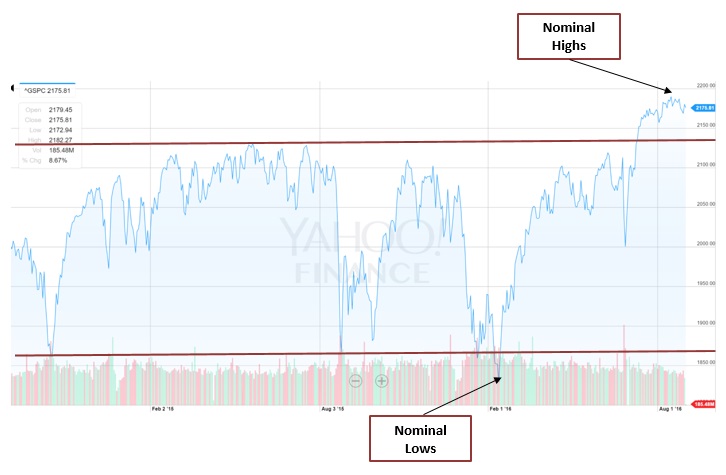
Chart IV – Two Year Sideways Chart of S&P 500 With Nominal Recent Lows and Highs
The key insight is that these marginal new highs are being achieved on deteriorating fundamentals, which is not a good sign for future returns.
While GDP has not yet gone negative, it is flirting with levels that previously triggered recessions shortly thereafter (see Chart V below).

Chart V – Recent GDP Declines Indicating Higher Risk of Recession Ahead
Additionally, the driver of future market returns is corporate profits.
Here too the story isn’t good, as corporate profits appeared to have peaked 6 quarters ago in late 2014 (see chart VI below).
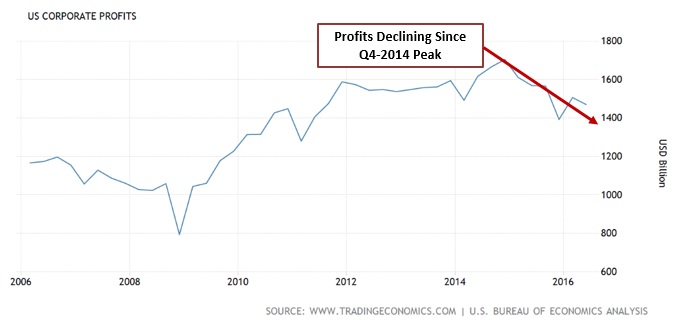
Chart VI – US Corporate Profits Over Past 10 Years, Now Declining for 6 Quarters
While the verdict isn’t fully in, these are strong signs that fundamentals are getting unhinged as investors pile back into US investment markets.
Humans have survived and thrived on our planet because of our ability for rational thought…
…so when you see irrational buying behavior, combined with the jet fuel of excessive leverage, it has historically been prudent to run for the hills as fast as you can.
Many of the people who were scared into selling at lows in 2008-2009 when the world was thought to be ending, are the same people who now think that the Fed will protect all and the only direction for markets is up.
Our best estimates, which combine a number of historically reliable indicators, predict that future 10 year returns in the US will average 2.57% for stocks and 3.17% for core fixed income.
Furthermore, current valuations point to the very high likelihood that these lackluster returns will be accompanied by major volatility in the period ahead, which will likely shake these “investors” out of their positions once again, creating a negative return for many.
So what is one to do?
Seeking Smart Return While Remaining Patient
While we have preached patience in public markets, there are pockets of opportunity that we have begun to exploit for clients.
With select commodity markets now down over 50%, we have picked through the rubble to find some interesting opportunities, and portfolios are now slightly overweight this asset class.
We have also nibbled in select emerging markets that have declined heavily, where valuations are now more reasonable, and economics don’t appear dire.
For accredited clients, we continue to source and introduce an income-producing private opportunities in recession-resilient sectors.
The best practice in this segment is to find emerging managers that have proven experience but are not large enough to either close their doors to new investors, or to have become more vanilla main-stream offerings with lower returns or higher fees.
Finding this window requires a lot of hustle and effort, but the spoils to date have been more than worth the extra sweat.
We will be sending our LGA accredited clients a more detailed update to this very popular private investment program on Sept 1st.
Outside of the above mentioned investment areas, we remain heavily defensive, in protection mode for clients.
Tactical portfolios hold cash and hedges, waiting for when the Fed drugs no longer work on the patient, and the US economy finally overdoses.
We want our clients to be one of the few with available cash to take advantage of what may potentially be a once-in-a-generation buying opportunity in the years ahead.
For more fully-invested portfolios, we have filled in the gaps with more defensive sectors of the markets, despite them too being a bit overvalued.
As the declines ahead materialize (one sector at a time, or all at the same time), we will continue to get client’s dry powder put back to work.
The upcoming 12-24 months are expected to be quite volatile, and should benefit from the tactical strategies that we employ at LotusGroup.
Hope you are well…and are actively embracing life’s opportunities and challenges.
Cheers!