Summertime typically provides me with an opportunity to better balance work with play, as my two teenage kiddoes have a bit more free time and the warm weather entices me to get out of the office. One of my favorite pastimes is playing golf in the late summer afternoons as the daylight hours extend. While I am drawn to golf’s incredible challenge (apparently a personal affliction), it also provides me with the opportunity to spend time with fascinating people. Rather than the typical 10 second text, 2-minute phone conversation or 30-minute meeting, I get to enjoy 4-5 dedicated hours in a foursome of folks. Inevitably, I almost always end up learning something interesting about their lives, acquired knowledge, life lessons and personal pursuits. Toss in a wonderful outdoor setting, some fun travel destinations, and an occasional birdie…and my life is refreshed and rebalanced.
Interestingly, one tends to hear a lot about investment topics on the golf course, including questions like, “What do you think about the S&P 500?”, or typical brags about a stock, “I made 3x on Zoom stock last year!” It certainly is interesting to hear the diversity of confidence that people express when it comes to personal investing.
This summer, there appears to be a bit more humility on the golf course, with previously “obvious” investments turning in some major recent losses. Growth stocks, tech darlings and crypto all have fallen dramatically, leaving a crowd of investors stung and far less confident. My take on the most common question this summer is shared below:
Hot Summer Topic – How Will Growth & Inflation Affect My Returns?
It is generally known that economic growth is often coupled with a rising stock market. When the economy is growing, GDP is advancing, and company profits tend to be secure. The opposite is also true, as public stock markets have tended to decline during recessions when GDP contracts for multiple quarters in a row.
Interestingly, public fixed income markets (bonds) are often negatively correlated to public stocks, meaning they move in the opposite direction. When economic growth is strong, rates tend to rise which can hurts bond prices. Similarly, when economic growth is weak, rates tend to decline which tends to help bond prices. This phenomenon does not occur 100% of the time, but it does often follow this general trend.
Given the above, classically trained investment managers include both stocks and bonds in portfolios so that they can lower volatility across both strong and weak economic time periods. Inclusion of both assets also creates rebalancing opportunities to buy low and sell high at extremes of either of these two asset classes.
This approach worked well for the last 40-50 years…. until 2022!
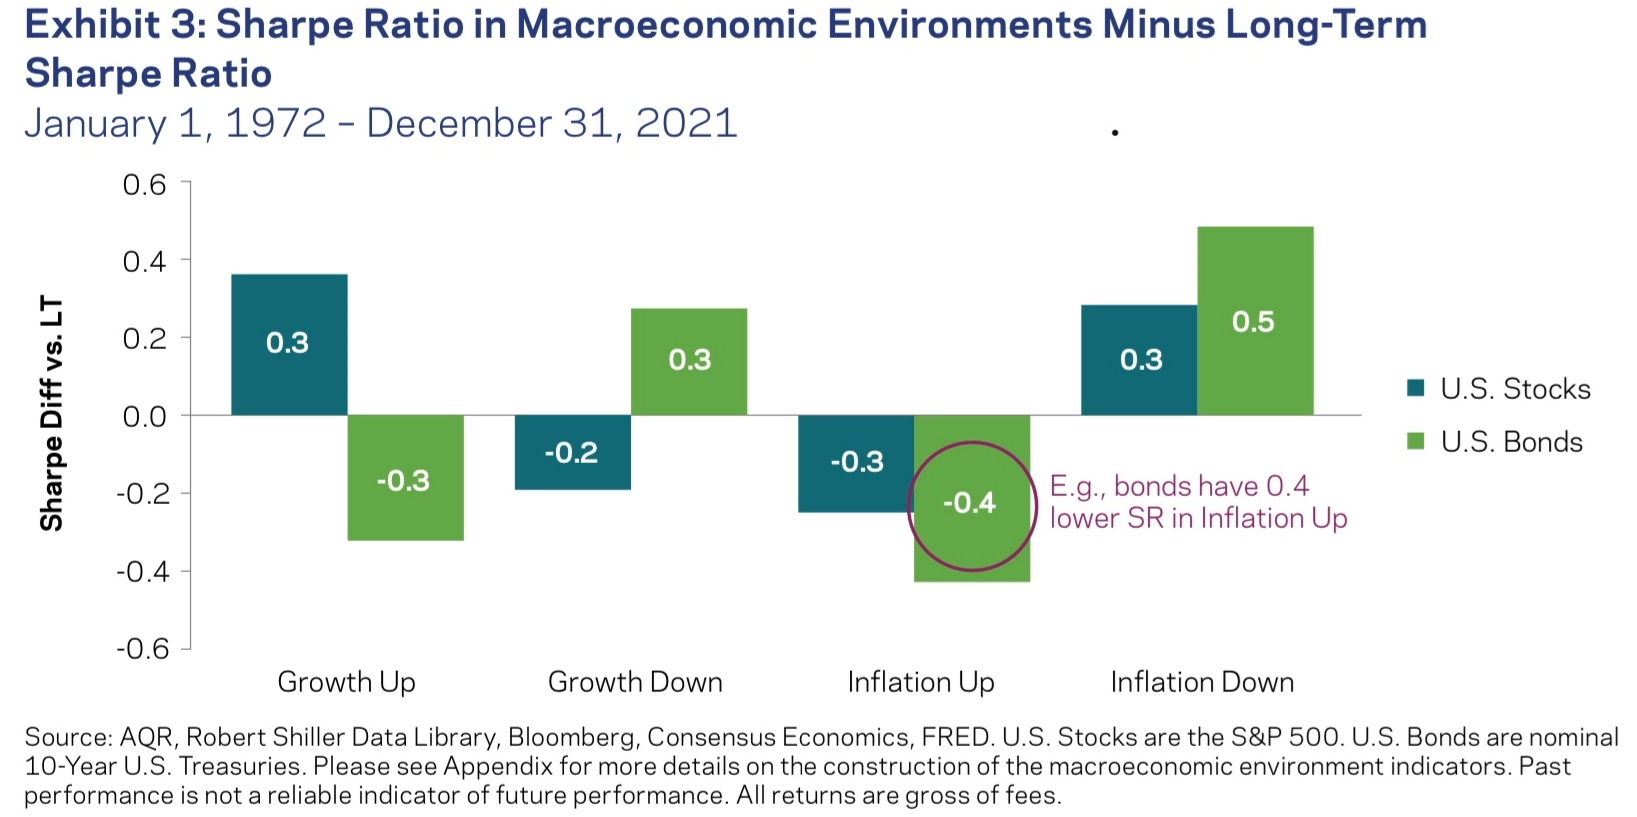
The wildcard is when public stocks and bonds move in the same direction due to a major inflation change, which is rare. Chart I below was expertly put together by one of the liquid alts managers that we use to diversify client portfolios. The left side of Chart I shows how economic growth trends cause US stock and bond returns to move in opposite directions, as expected. The right side shows the outlier case when inflation becomes volatile and US stocks and bonds move in the same direction. In the rare historical instances when the Federal Reserve does not keep inflation in check, stocks and bonds both lose value, traditional portfolio diversification is futile, and volatility dramatically increases.
Chart I – Stocks vs Bonds in Growth & Inflation Environments
We previously warned about this high inflation outlier scenario in our Q1 2022 LGA post.
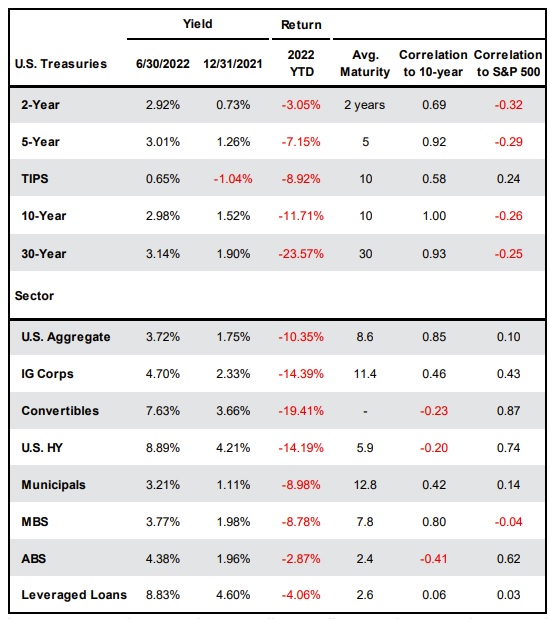
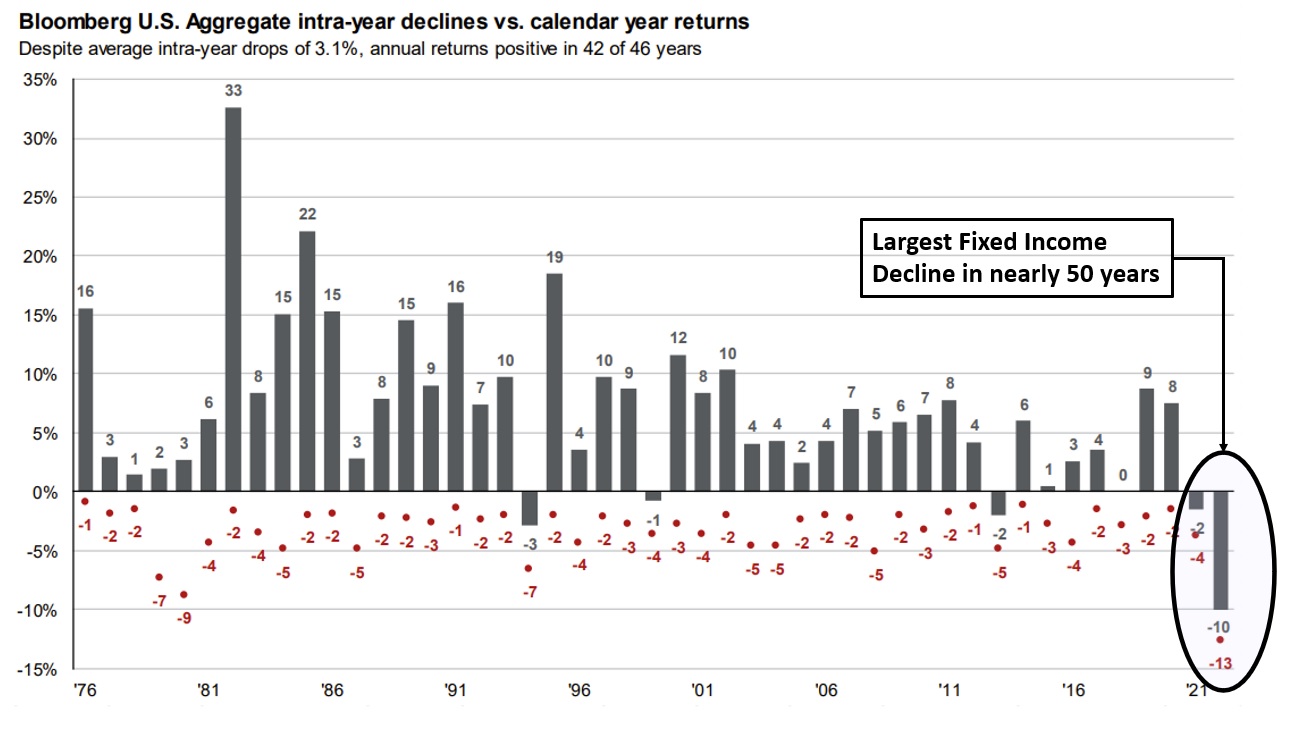
Consequently, stock prices have since declined 20%+ while fixed income has also followed suit with a 10%+ decline (see “U.S. Aggregate” in Chart II below).
Chart II – 2022 YTD Fixed Income Returns (Source: JP Morgan)
Younger and more aggressive investors seem to be taking the 20% downturn in stride. While few enjoy a shrinking balance, their nerves can be eased by focusing on a long investment timeframe, ability to continue earning money, and opportunity to dollar cost average into the markets.
Unfortunately, older, and more conservative investors appear to be shocked at this rare convergence of negative returns. The traditional playbook of being “safe” with fixed income has backfired, and their portfolios are down dramatically more than expected.
LotusGroup clients have fortunately avoided most of these fixed income declines given our multi-year tactical underweight to the sector.
While LGA public strategies have blunted recent losses, our private investments continued to produce positive returns.
I encourage you to read Stephanie’s Public Market Update to learn more about our recent positioning during the largest fixed income decline in nearly 50 years, and our portfolio’s relative outperformance using lower beta, liquid alternatives and market hedges.
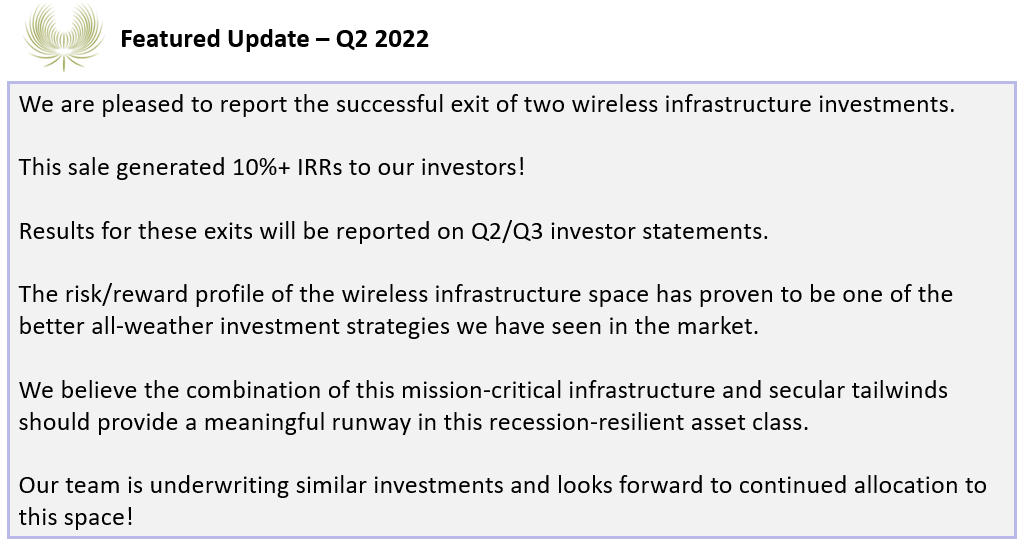
I also encourage you to read Louis’ Private Market Update, including news about some strong recent exits and an example of additional opportunities we are sourcing.
As always, thank you for the trust in our work and your continued friendship.
Cheers – Raph
P.S. I hope you too are enjoying a balanced summer and finding ways to enjoy the company of others!
Public Market Update – Q2/2022
Stephanie Schlemeyer: Partner & Portfolio Manager, Public Markets
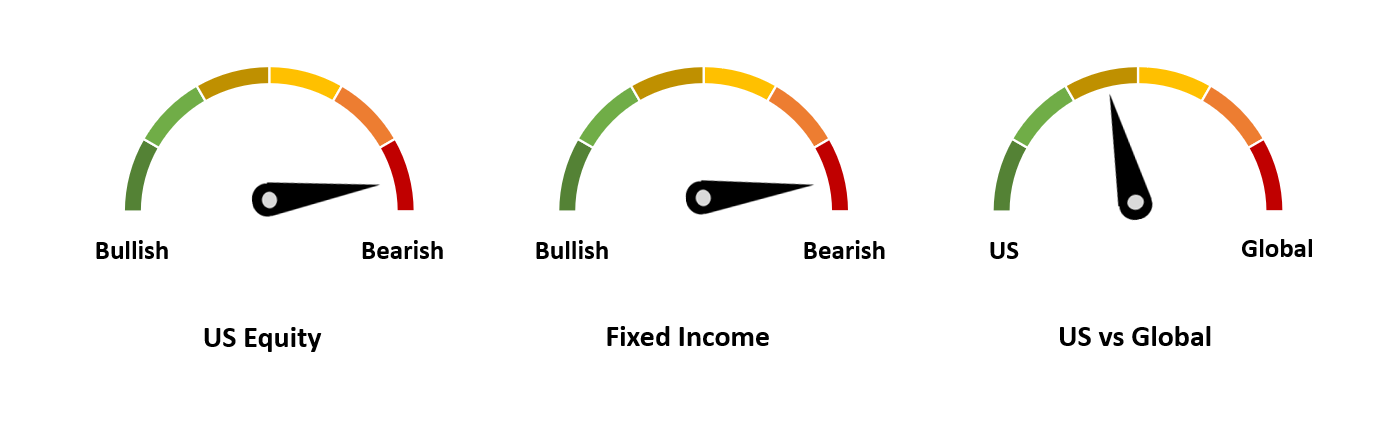
Two of our public market gauges remain unchanged since last quarter:
Fixed Income remains bearish
We still have a tilt toward US vs Global.
The US Equity gauge, however, moved from bullish to bearish based on the breakdown of our technical indicators during Q2.
Net-net, our managed-portfolios changed in the following ways during Q2:
Market exposure was reduced to 0% for Tactical portfolios
Market exposure was reduced to 50% for Global Rotation portfolios
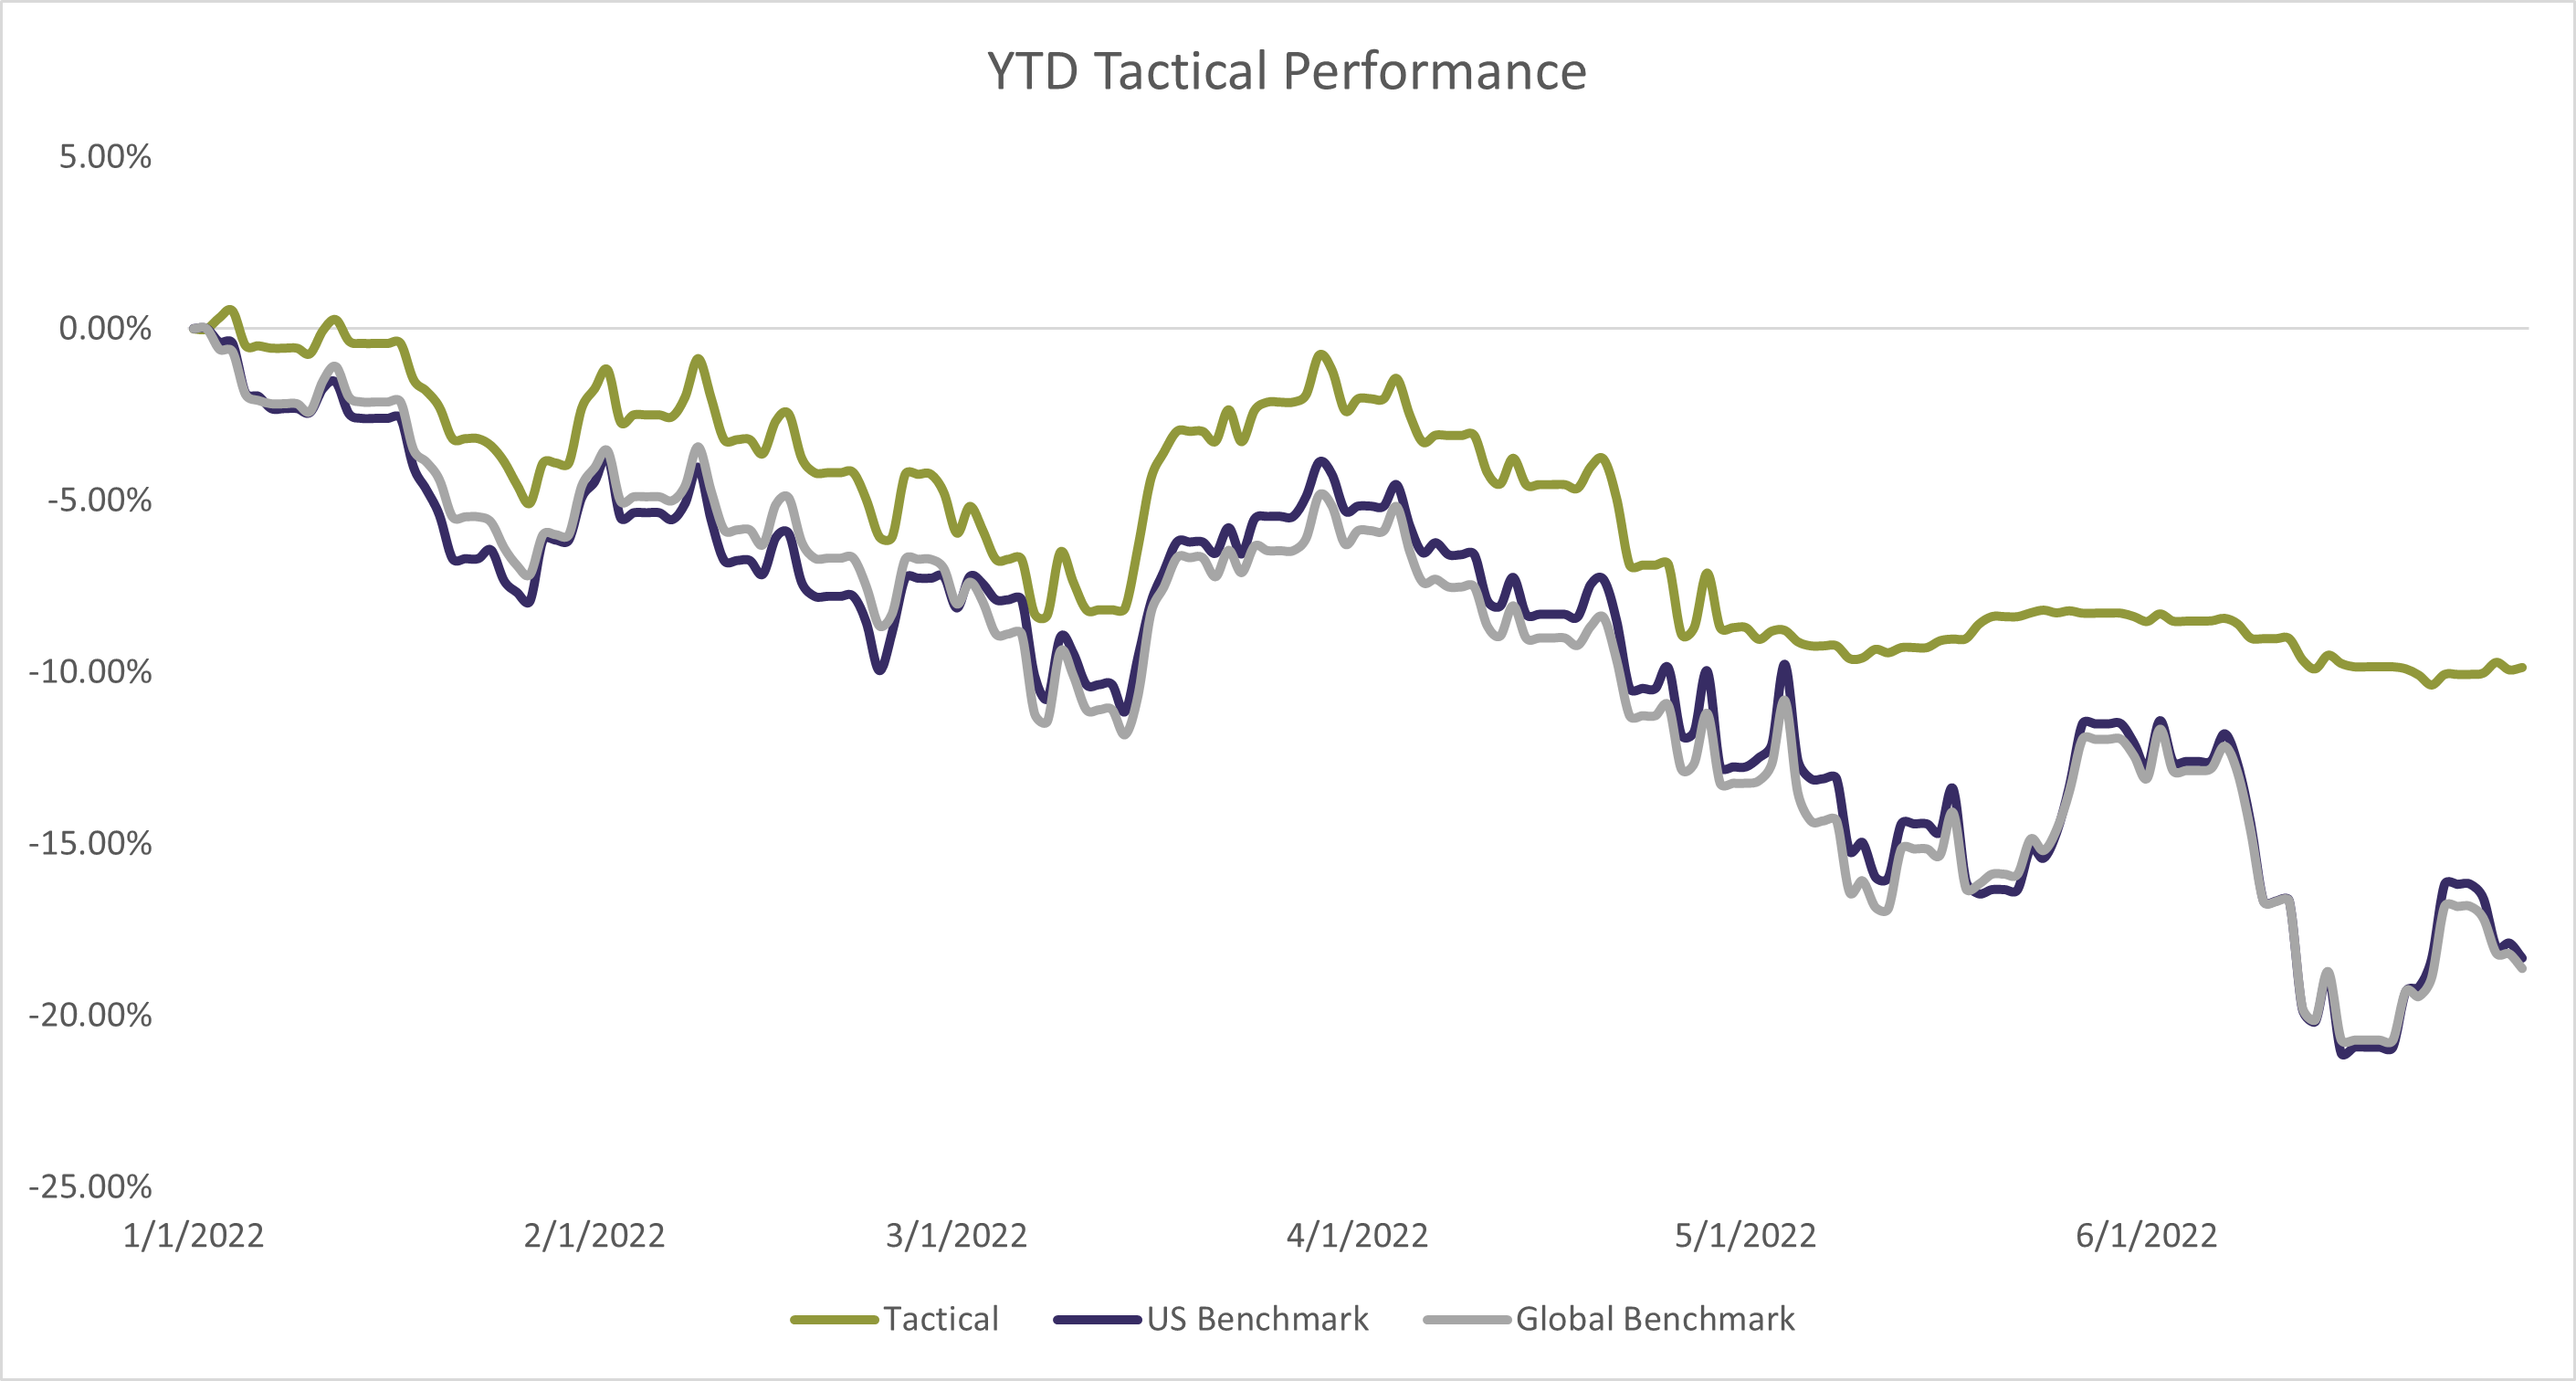
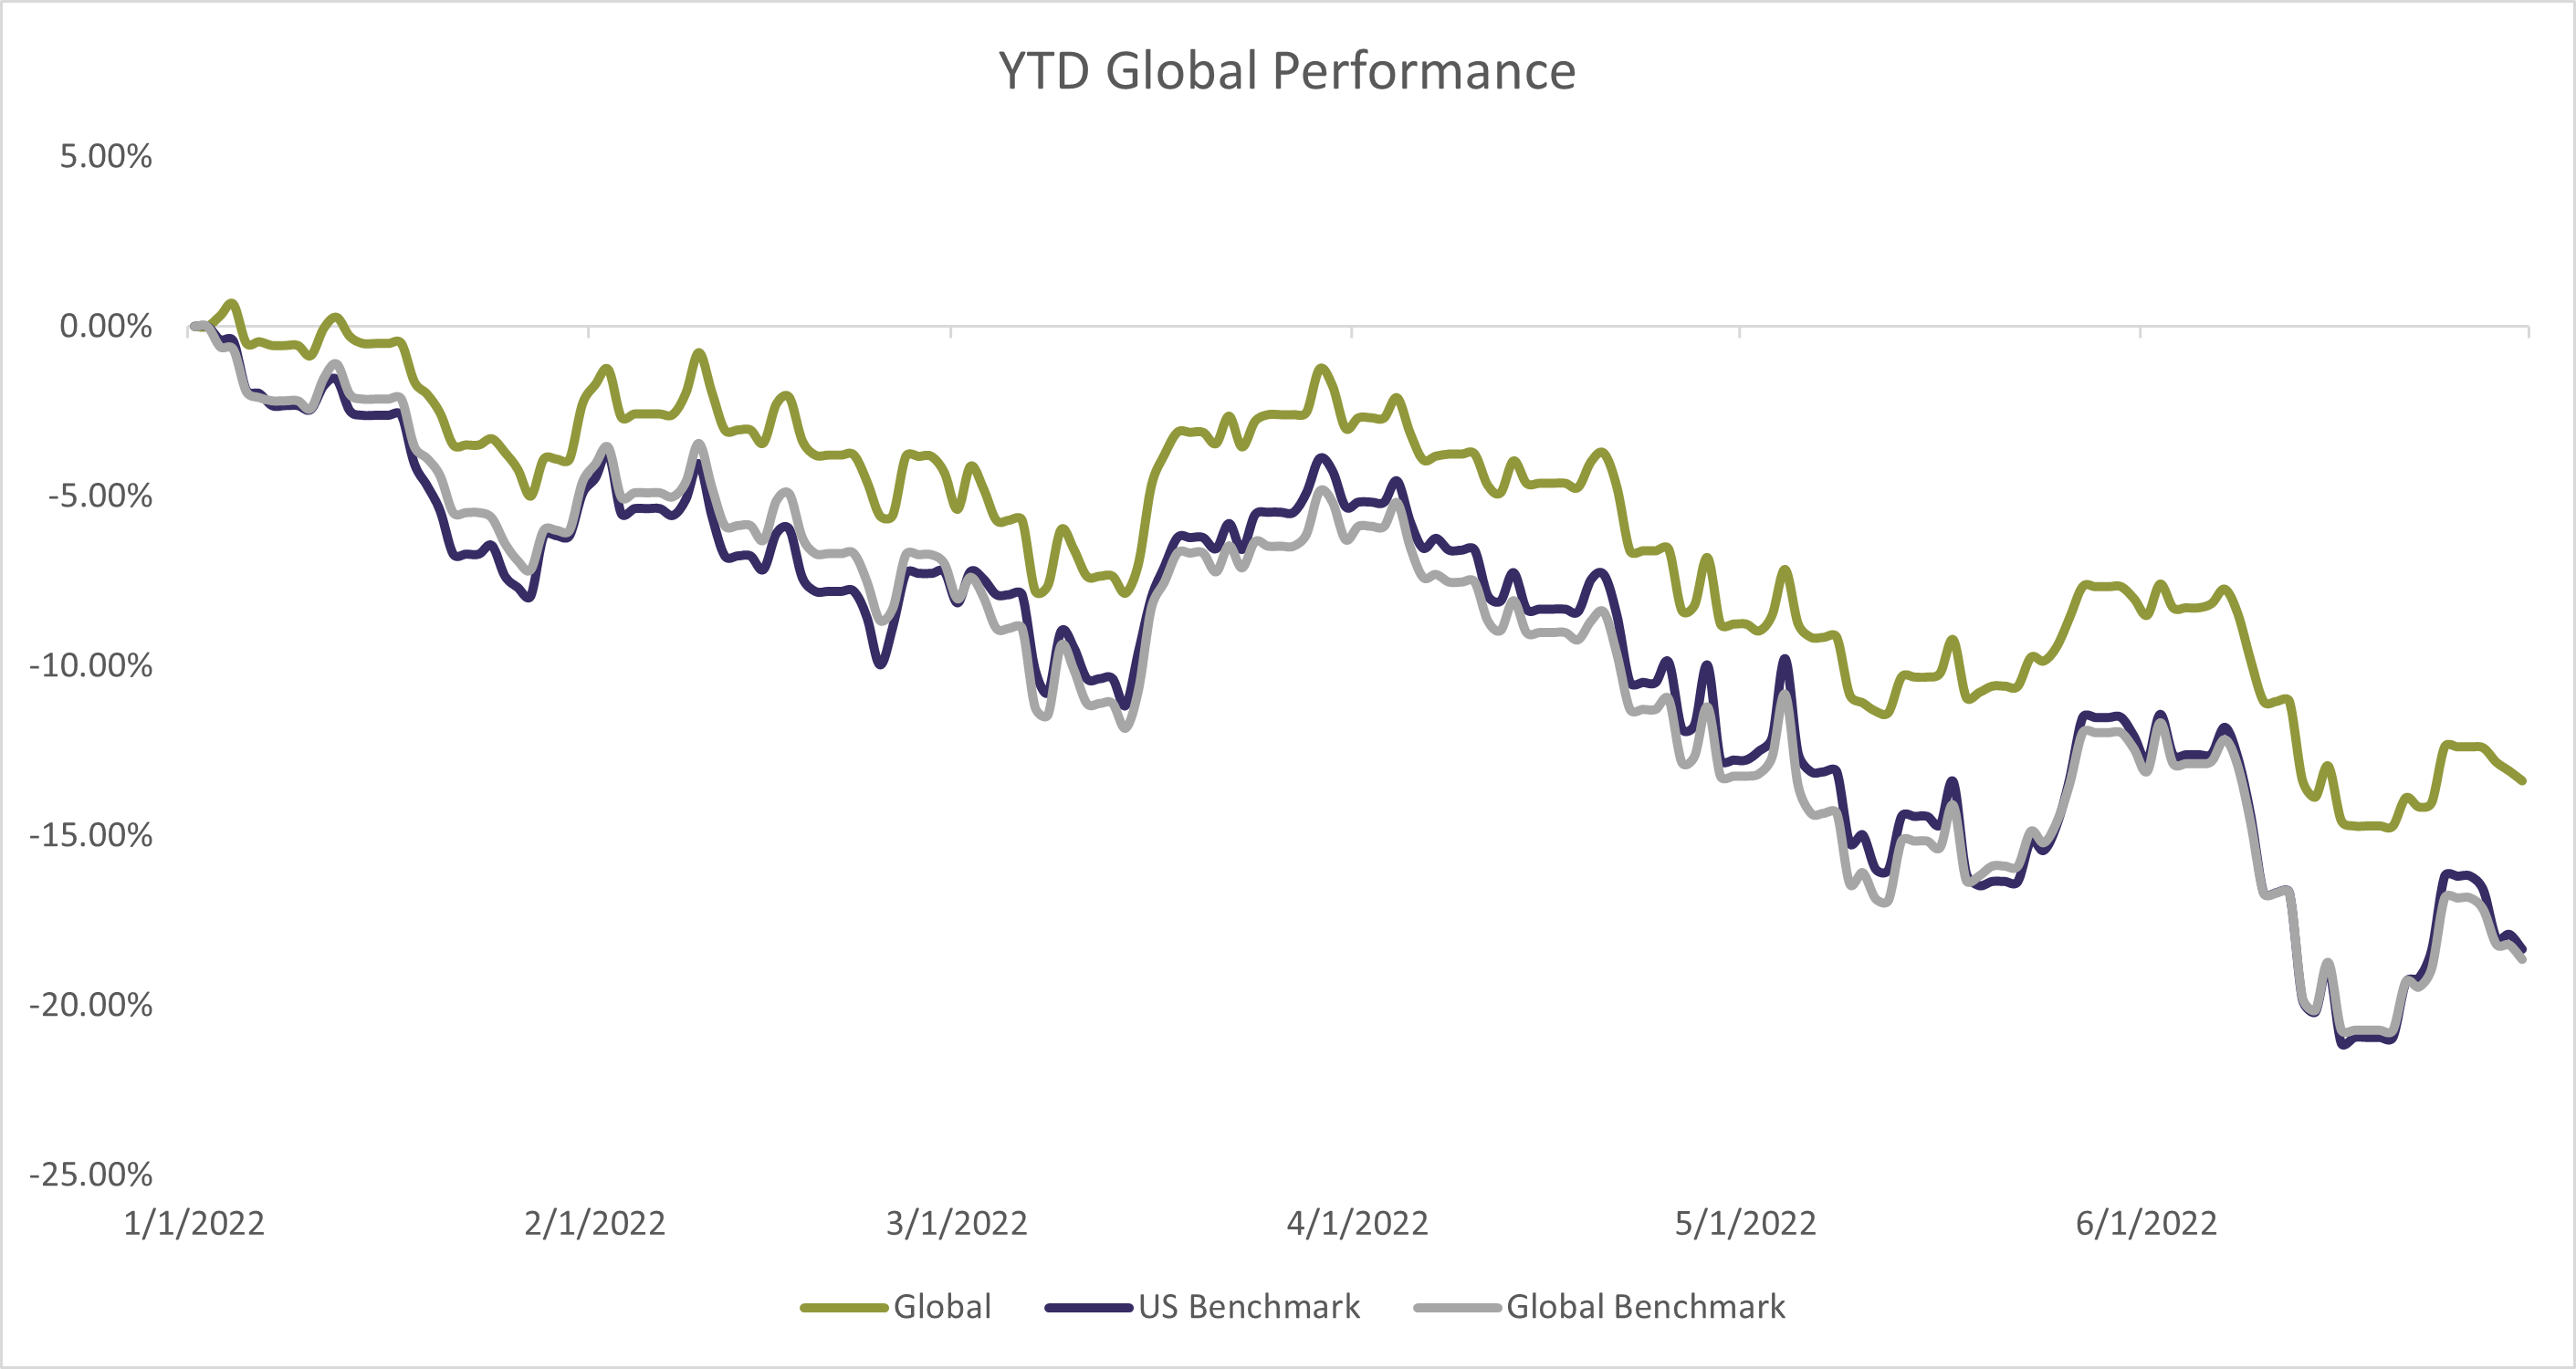
The two charts below show how an average LGA public portfolio performed thru the first half of 2022 relative to US and Global Benchmarks:
Chart III – LGA Tactical Portfolio Performance (Source: LGA)
Chart IV – LGA Global Rotation Portfolio Performance (Source: LGA)
LGA moved to this defensive positioning in late April, as illustrated above in green, with tactical portfolios delivering a nearly flat result thereafter while global rotation portfolios had a muted decline. These results compare positively against 20%+ public equity market declines and 10-20% public fixed income market declines (some of the largest declines for fixed income in the past 50 years – see chart below)!
Chart V – Fixed Income Returns Over Past 50 Years
We also rebalance portfolios several times during Q2, selling high and buying low in a market with higher volatility. This technique not only helps improve long-term returns, but it also helps keep client allocations and desired risk levels intact.
We continue to monitor our proprietary and internal models which drive our decisions on the three strategy gauges above. As always, there will come a time when we receive the “all clear” around adding back exposure in both equities and fixed income.
We remain disciplined, diversified, continue to rebalance and continuing to monitor internal and external indicators for any changes that could take place.
Private Market Update – Q2/2022
Louis Frank: Portfolio Manager, Private Market
LotusGroup’s private program has historically focused on defensive, income-producing, and recession-resilient alternative investments.
Incorporating these strategies has remained a ballast and accretive addition to our investment portfolios (as Raph mentioned above).
These positive returns continued in 1H/2022, especially with our private credit investments significantly outperforming public fixed income.
Opportunities Ahead
Many of history’s most famous investors have made their fortunes off buying quality assets at distressed prices.
Recessionary environments tend to bring both disruption and opportunity across a number of asset classes.
Perhaps the most famous investor, Warren Buffet, made almost $10 Billion during the Great Financial Crisis (click here)!
Our internal indicators suggest that the current landscape could lead to a similar opportunity set ahead.
While waiting for this potential outcome, we continue to find innovative and recession-resilient opportunities.
We touch on one example of that below – IP Lending!
Current Due Diligence > Intellectual Property (“IP”) Lending
We recently sourced a new opportunity that creatively lends against intellectual property (“IP”).
This strategy fills a void left by traditional banks, who have focused on more traditional lending for the past few decades.
The market opportunity is considerable given that IP now represents approximately 85% of S&P 500 balance sheets, driven by our eonomy’s 20-year shift away from asset-intensive industries and towards IP-driven sectors.
Key Investment Characteristics:
Senior secured positioning
Low Loan-to-Values (<50%)
A contractual limit to a 10% maximum downside
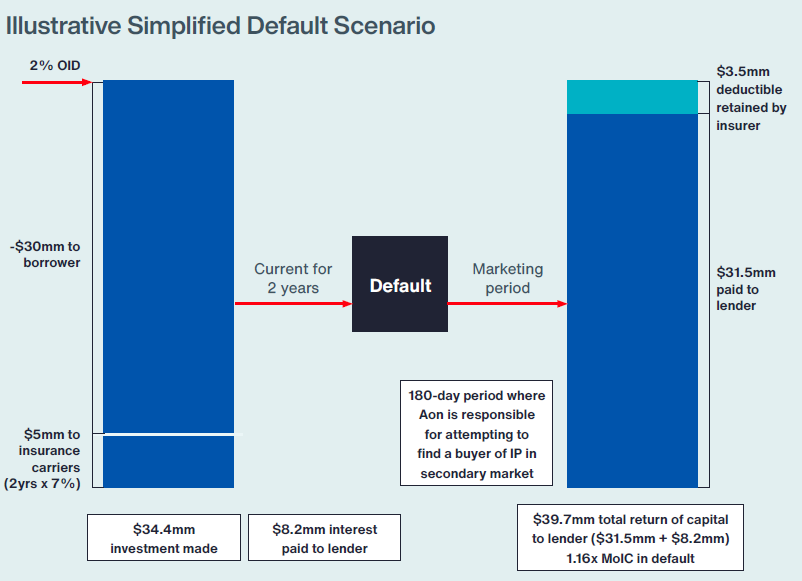
#3 above is delivered through a unique structure.
The manager places an insurance wrapper around each underlying loan in the portfolio.
This wrapper limits the downside to 10% on any individual investment (default scenario illustrated below):
Chart VI – IP Lending Illustrative Default (Source: Fund Specific Marketing Material)
The insurance wrapper, diversification and strong cash coupon give the strategy downside protection.
We are still underwriting the opportunity and will keep you posted on new developments ahead.
In the meanwhile, we will continue monitoring our existing committments and currently positive contributions to client portfolios.


 LotusGroup’s private program has historically focused on defensive, income-producing, and recession-resilient alternative investments.
Incorporating these strategies has remained a ballast and accretive addition to our investment portfolios (as Raph mentioned above).
These positive returns continued in 1H/2022, especially with our private credit investments significantly outperforming public fixed income.
Opportunities Ahead
Many of history’s most famous investors have made their fortunes off buying quality assets at distressed prices.
Recessionary environments tend to bring both disruption and opportunity across a number of asset classes.
Perhaps the most famous investor, Warren Buffet, made almost $10 Billion during the Great Financial Crisis (click here)!
Our internal indicators suggest that the current landscape could lead to a similar opportunity set ahead.
While waiting for this potential outcome, we continue to find innovative and recession-resilient opportunities.
We touch on one example of that below – IP Lending!
Current Due Diligence > Intellectual Property (“IP”) Lending
We recently sourced a new opportunity that creatively lends against intellectual property (“IP”).
This strategy fills a void left by traditional banks, who have focused on more traditional lending for the past few decades.
The market opportunity is considerable given that IP now represents approximately 85% of S&P 500 balance sheets, driven by our eonomy’s 20-year shift away from asset-intensive industries and towards IP-driven sectors.
Key Investment Characteristics:
LotusGroup’s private program has historically focused on defensive, income-producing, and recession-resilient alternative investments.
Incorporating these strategies has remained a ballast and accretive addition to our investment portfolios (as Raph mentioned above).
These positive returns continued in 1H/2022, especially with our private credit investments significantly outperforming public fixed income.
Opportunities Ahead
Many of history’s most famous investors have made their fortunes off buying quality assets at distressed prices.
Recessionary environments tend to bring both disruption and opportunity across a number of asset classes.
Perhaps the most famous investor, Warren Buffet, made almost $10 Billion during the Great Financial Crisis (click here)!
Our internal indicators suggest that the current landscape could lead to a similar opportunity set ahead.
While waiting for this potential outcome, we continue to find innovative and recession-resilient opportunities.
We touch on one example of that below – IP Lending!
Current Due Diligence > Intellectual Property (“IP”) Lending
We recently sourced a new opportunity that creatively lends against intellectual property (“IP”).
This strategy fills a void left by traditional banks, who have focused on more traditional lending for the past few decades.
The market opportunity is considerable given that IP now represents approximately 85% of S&P 500 balance sheets, driven by our eonomy’s 20-year shift away from asset-intensive industries and towards IP-driven sectors.
Key Investment Characteristics: