Fall has arrived at LotusGroup, with leaves beginning to change colors outside our front office glass doors. As the days get shorter, one might think that early morning wakeups would get pushed back a bit. However, our team continues to amaze me with their dedication to getting the most out of each day.
As an example, Ms. Stephanie Schlemeyer leads our public investment team by getting up each morning at around 4am. In the past six months, she has used this early morning wake up to get in a workout, to study 14 hours per week for her CFA (Chartered Financial Analyst) designation, and to enjoy some quality morning hours with her young daughter Cameron. Those 4-5 hours of extra time are all put into play before her standard 8+ hour workday at LotusGroup, where she has skillfully navigated this year’s very volatile public investment markets. Steph recently added a new analyst to her team, helping with day-to-day activities and allowing her to spend more time on monitoring, researching and further developing our proprietary investment strategies and models. I am proud of the efforts and diligence she puts in each day, her dedication to taking care of our growing clientele, and how well Steph represents our mission of “maximizing human potential.” Well done Stephanie and congrats on recently passing the very difficult CFA Level I exam, where only 37% of test takers made it through!
On the investment front, I encourage you to read Stephanie’s update on public markets as well as Louis’ update on our work in the private alternative space. Both approaches to investment are critical to client portfolios in the current environment of volatile stagflation. On the public side, we continue to use broad diversification and tactical hedging to reduce drawdowns relative to 25%+ equity market declines and 15%+ fixed income declines. On the private side, we continue to focus on asset-backed investments that have a degree of historically demonstrated recession resiliency.
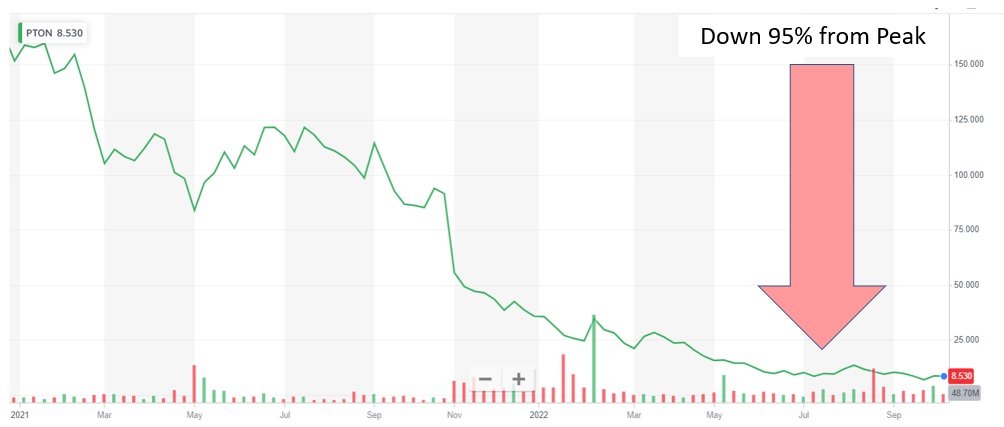
While we have focused on preserving client capital, the bullish tide has truly begun to recede with high debt and non-profitable business models left decimated. One example is previous market darling Peloton (ticker: PTON), the online / stationary bike / fitness company now down 95% from its peak. $100 invested in December 2020 would now be worth only $5, requiring a 2000% return going forward just to get back to break-even. What seemed to many as the next great “sure thing” growth story, has turned into a disaster for many performance chasers that felt they had to be invested alongside their neighbors and feared they were missing out on riches.
Chart I – Peloton Stock Performance Since Peak in Dec 2020
In the previously scorching-hot small-cap tech innovation space, the Peloton story has not been uncommon, and many firms have simply moved towards liquidation or forced fire sales to strategic acquirers. In the large-cap space, popular stocks like Facebook (now Meta), Amazon and Google (now Alphabet) have declined 30-60% from their peaks. Finally, large holders of fixed income have now endured 15-30%+ declines, the terrible “reward” for having previously chased after paltry 1-3% annual yields. This result has been devasting to many retirees that were told they would be “safe” in fixed income and had to always stay invested. Recent declines have wiped out a decade of fixed income distributions. Unfortunately, we have heard many repeat stories of this difficult tale from new clients who have come to us seeking a new path forward.
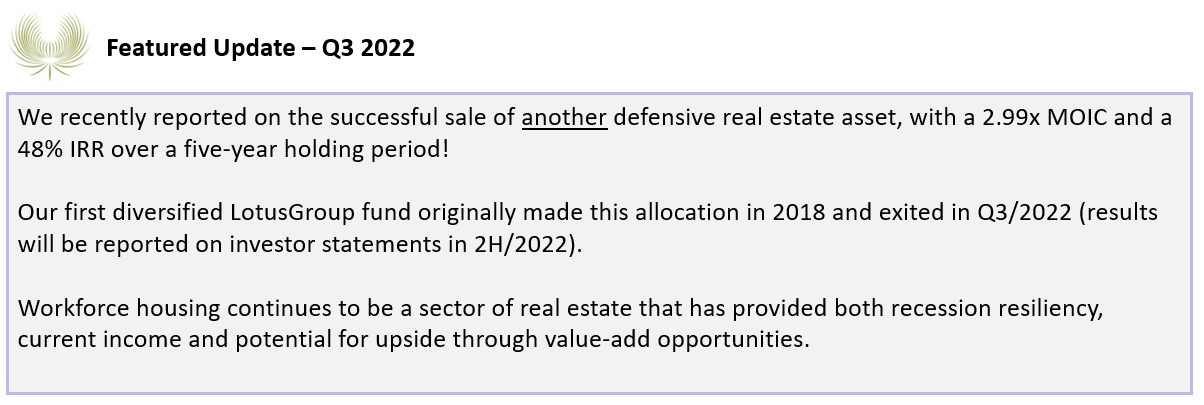
On the bright side, long-term opportunities have begun to present themselves to investors that preserved capital. For example, we have begun re-allocating to fixed income after multiple years of avoidance, recently deploying a portion of capital at 4%+ rates after sidestepping the 15-30%+ declines. On the equity side, we have yet to meaningfully allocate back into markets, but we continue to monitor for good re-entry points. Finally, our teams are actively seeking major dislocations in the private alternatives space while building cash positions from recent accretive exits (see our featured update in private alts section below for a nearly 3x recent exit).
While we cannot guarantee success, we can continue to promise you a value-based approach to investing your hard-earned savings. We can also continue to promise that our LotusGroup team of exceptional individuals will be working diligently on your behalf. We look forward to the periods ahead and the new opportunities that will present themselves – stay tuned!
As always, thank you for the trust in our work and continued friendship.
Public Market Update – Q3/2022
Stephanie Schlemeyer: Partner & Portfolio Manager, Public Markets
Two of our gauges remained the same from last quarter with US equity remaining bearish and a tilt to US vs Global equities.
There was a small change in the Fixed Income gauge, moving to a slightly less bearish reading.
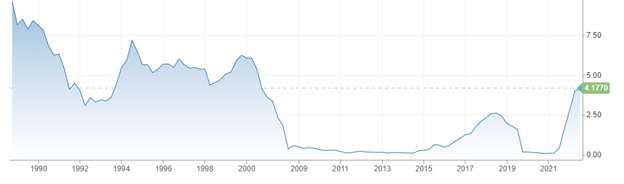
Yields on 1-year treasuries eclipsed 4% this quarter, a level not seen in short term yields for over 12 years (see Chart II below)!
Consequently, we began reallocating more conservative clients to Fixed Income after many years of holding virtually zero assets in this area.
Chart II – US 1 Year Treasury Yields (Source: CNBC)
If rates continue to rise, we will consider adding more to Fixed Income in the upcoming quarters.
Market volatility was also high in Q3, particularly with equities.
Our net equity market exposure (beta) remained at 0% of benchmark for Tactical portfolios and 50% of benchmark for Global Rotation portfolios.
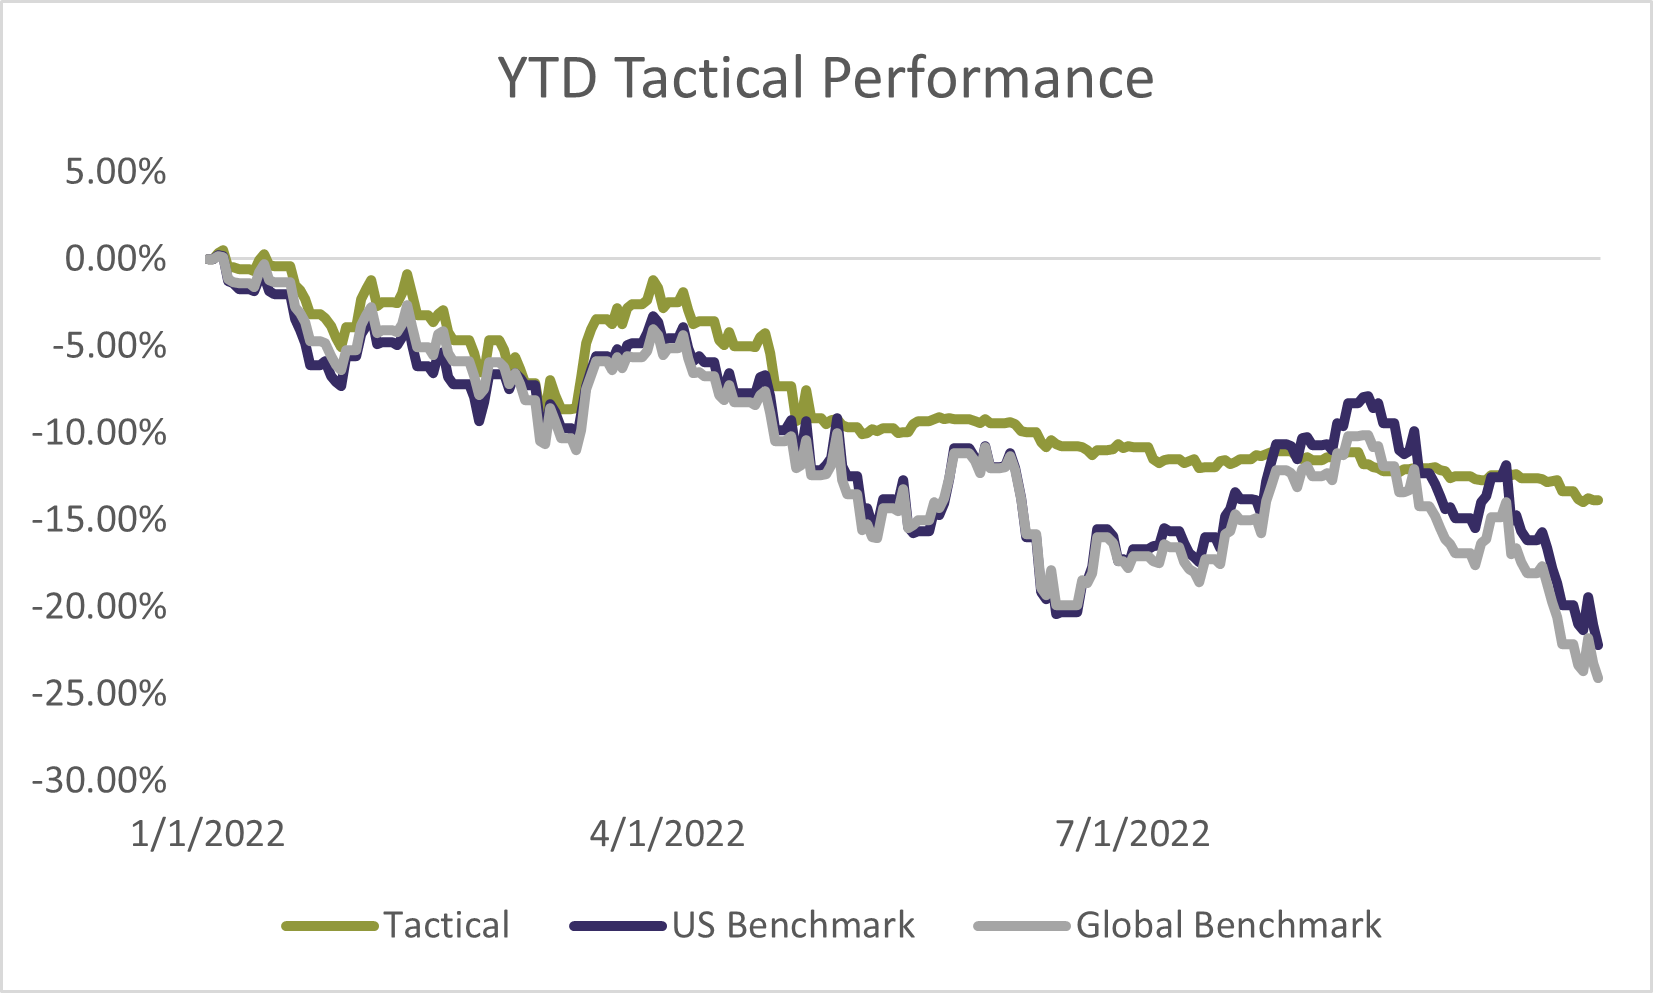
The three charts below show how an average LGA portfolio performed through 2022 relative to US and Global Benchmarks:
Chart III – LGA Tactical Portfolio Performance (Source: LGA)
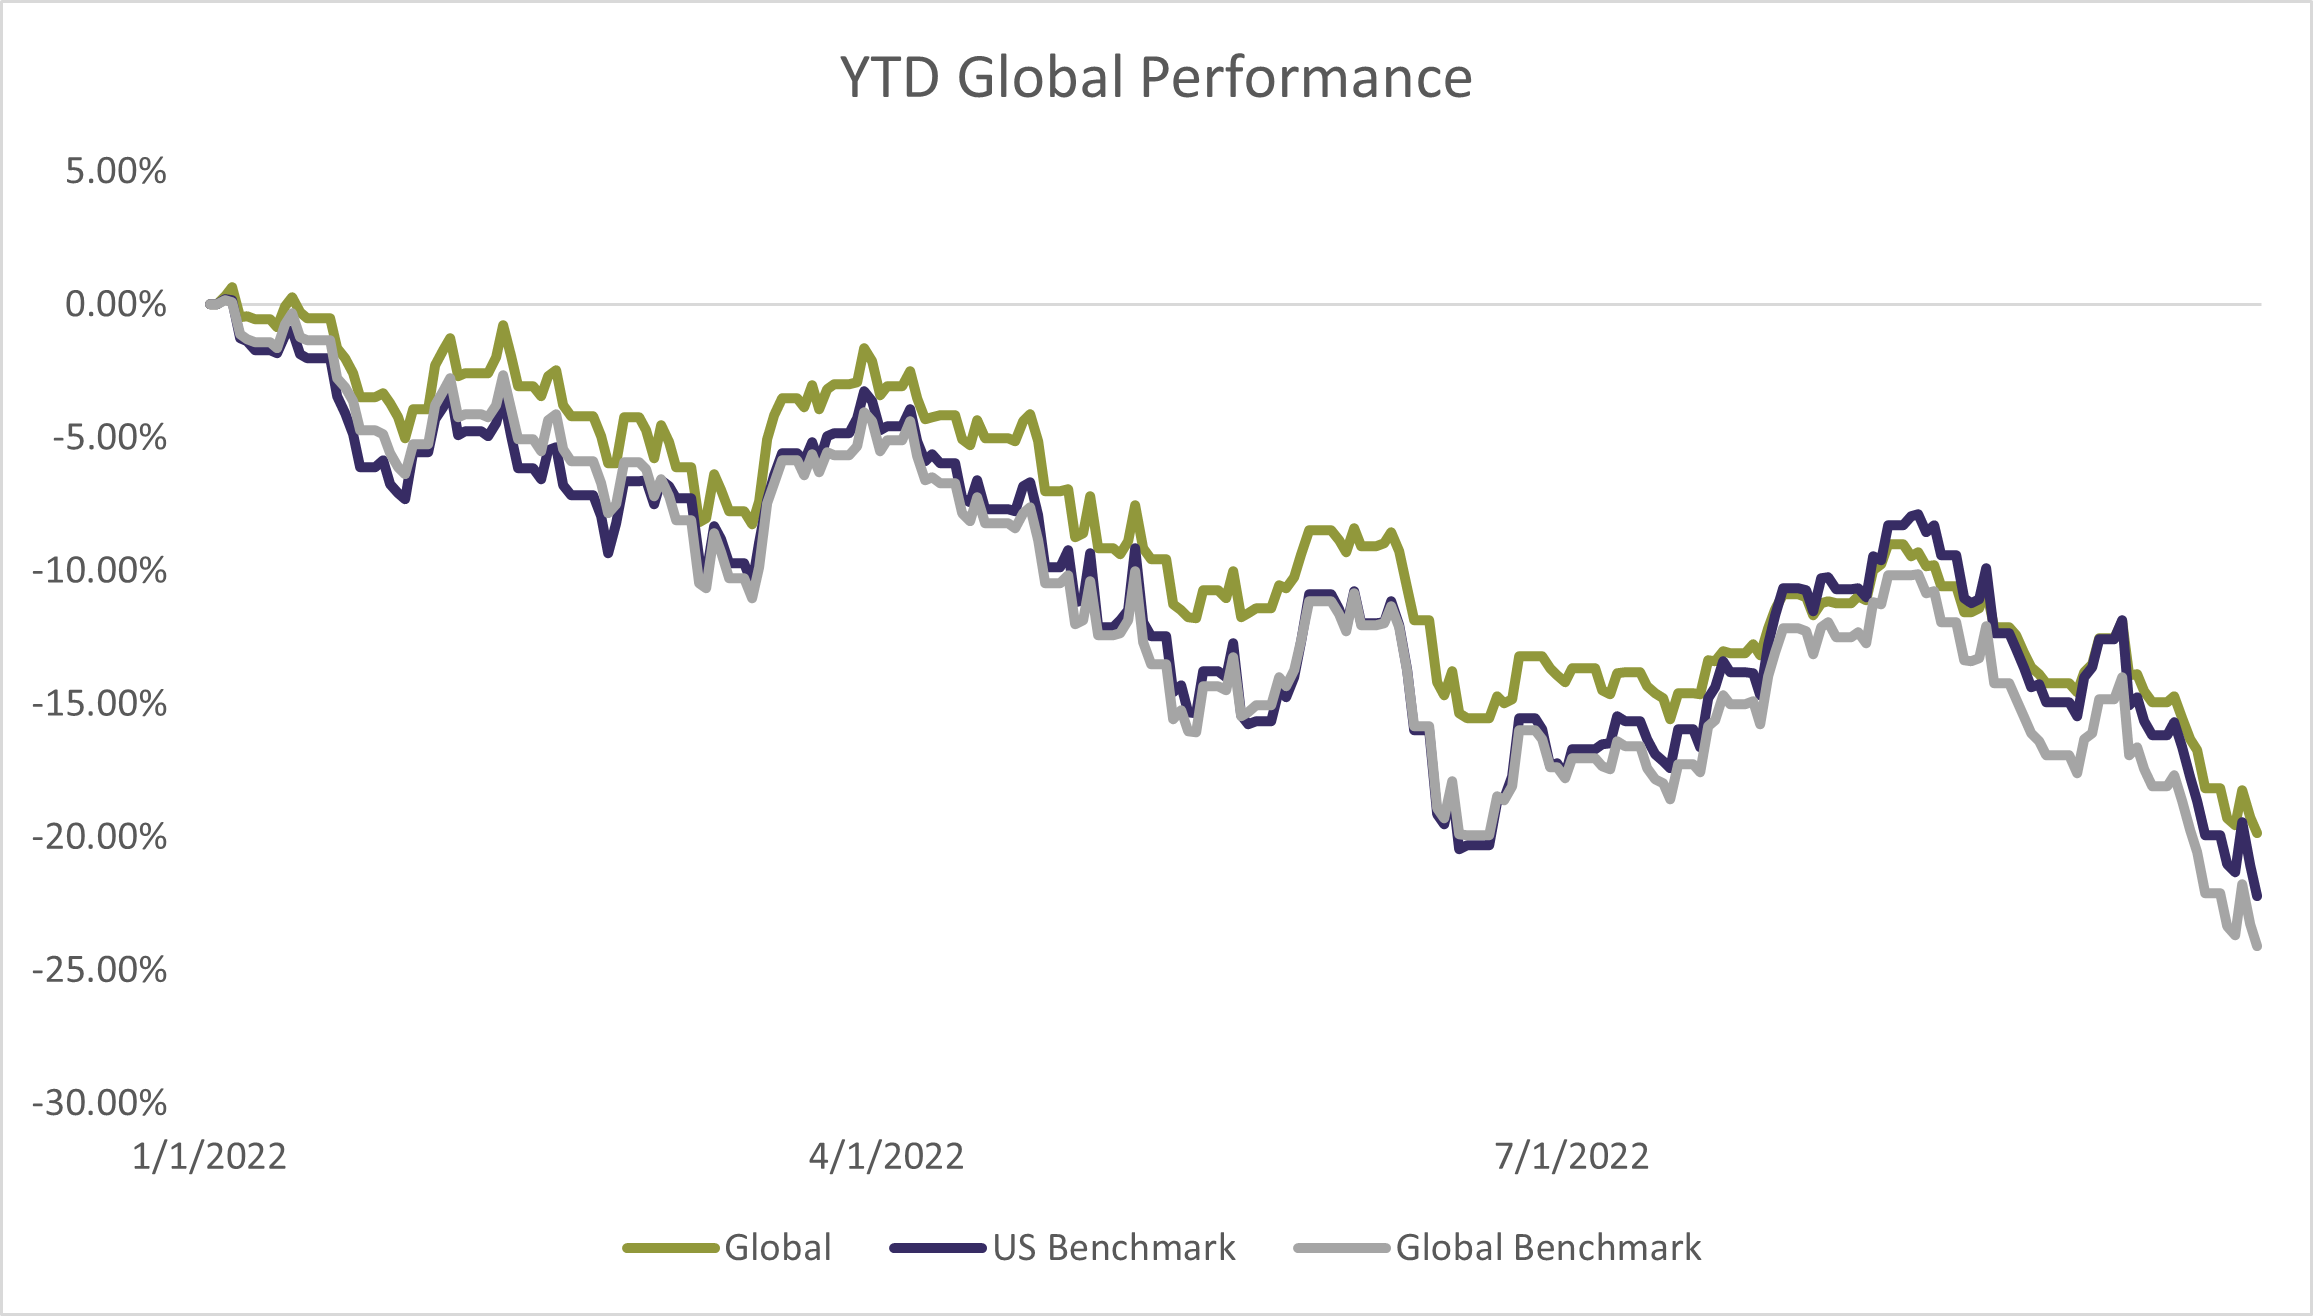
As a reminder, LotusGroup moved to a more defensive positioning in late April 2022. As illustrated by the green line in Chart III above, LGA Tactical portfolios delivered an almost flat return since moving to the more defensive positioning, while Global Rotation portfolios (chart IV below) participated a little more in the downside with greater exposure to the markets.
Chart IV – LGA Global Rotation Portfolio Performance (Source: LGA)
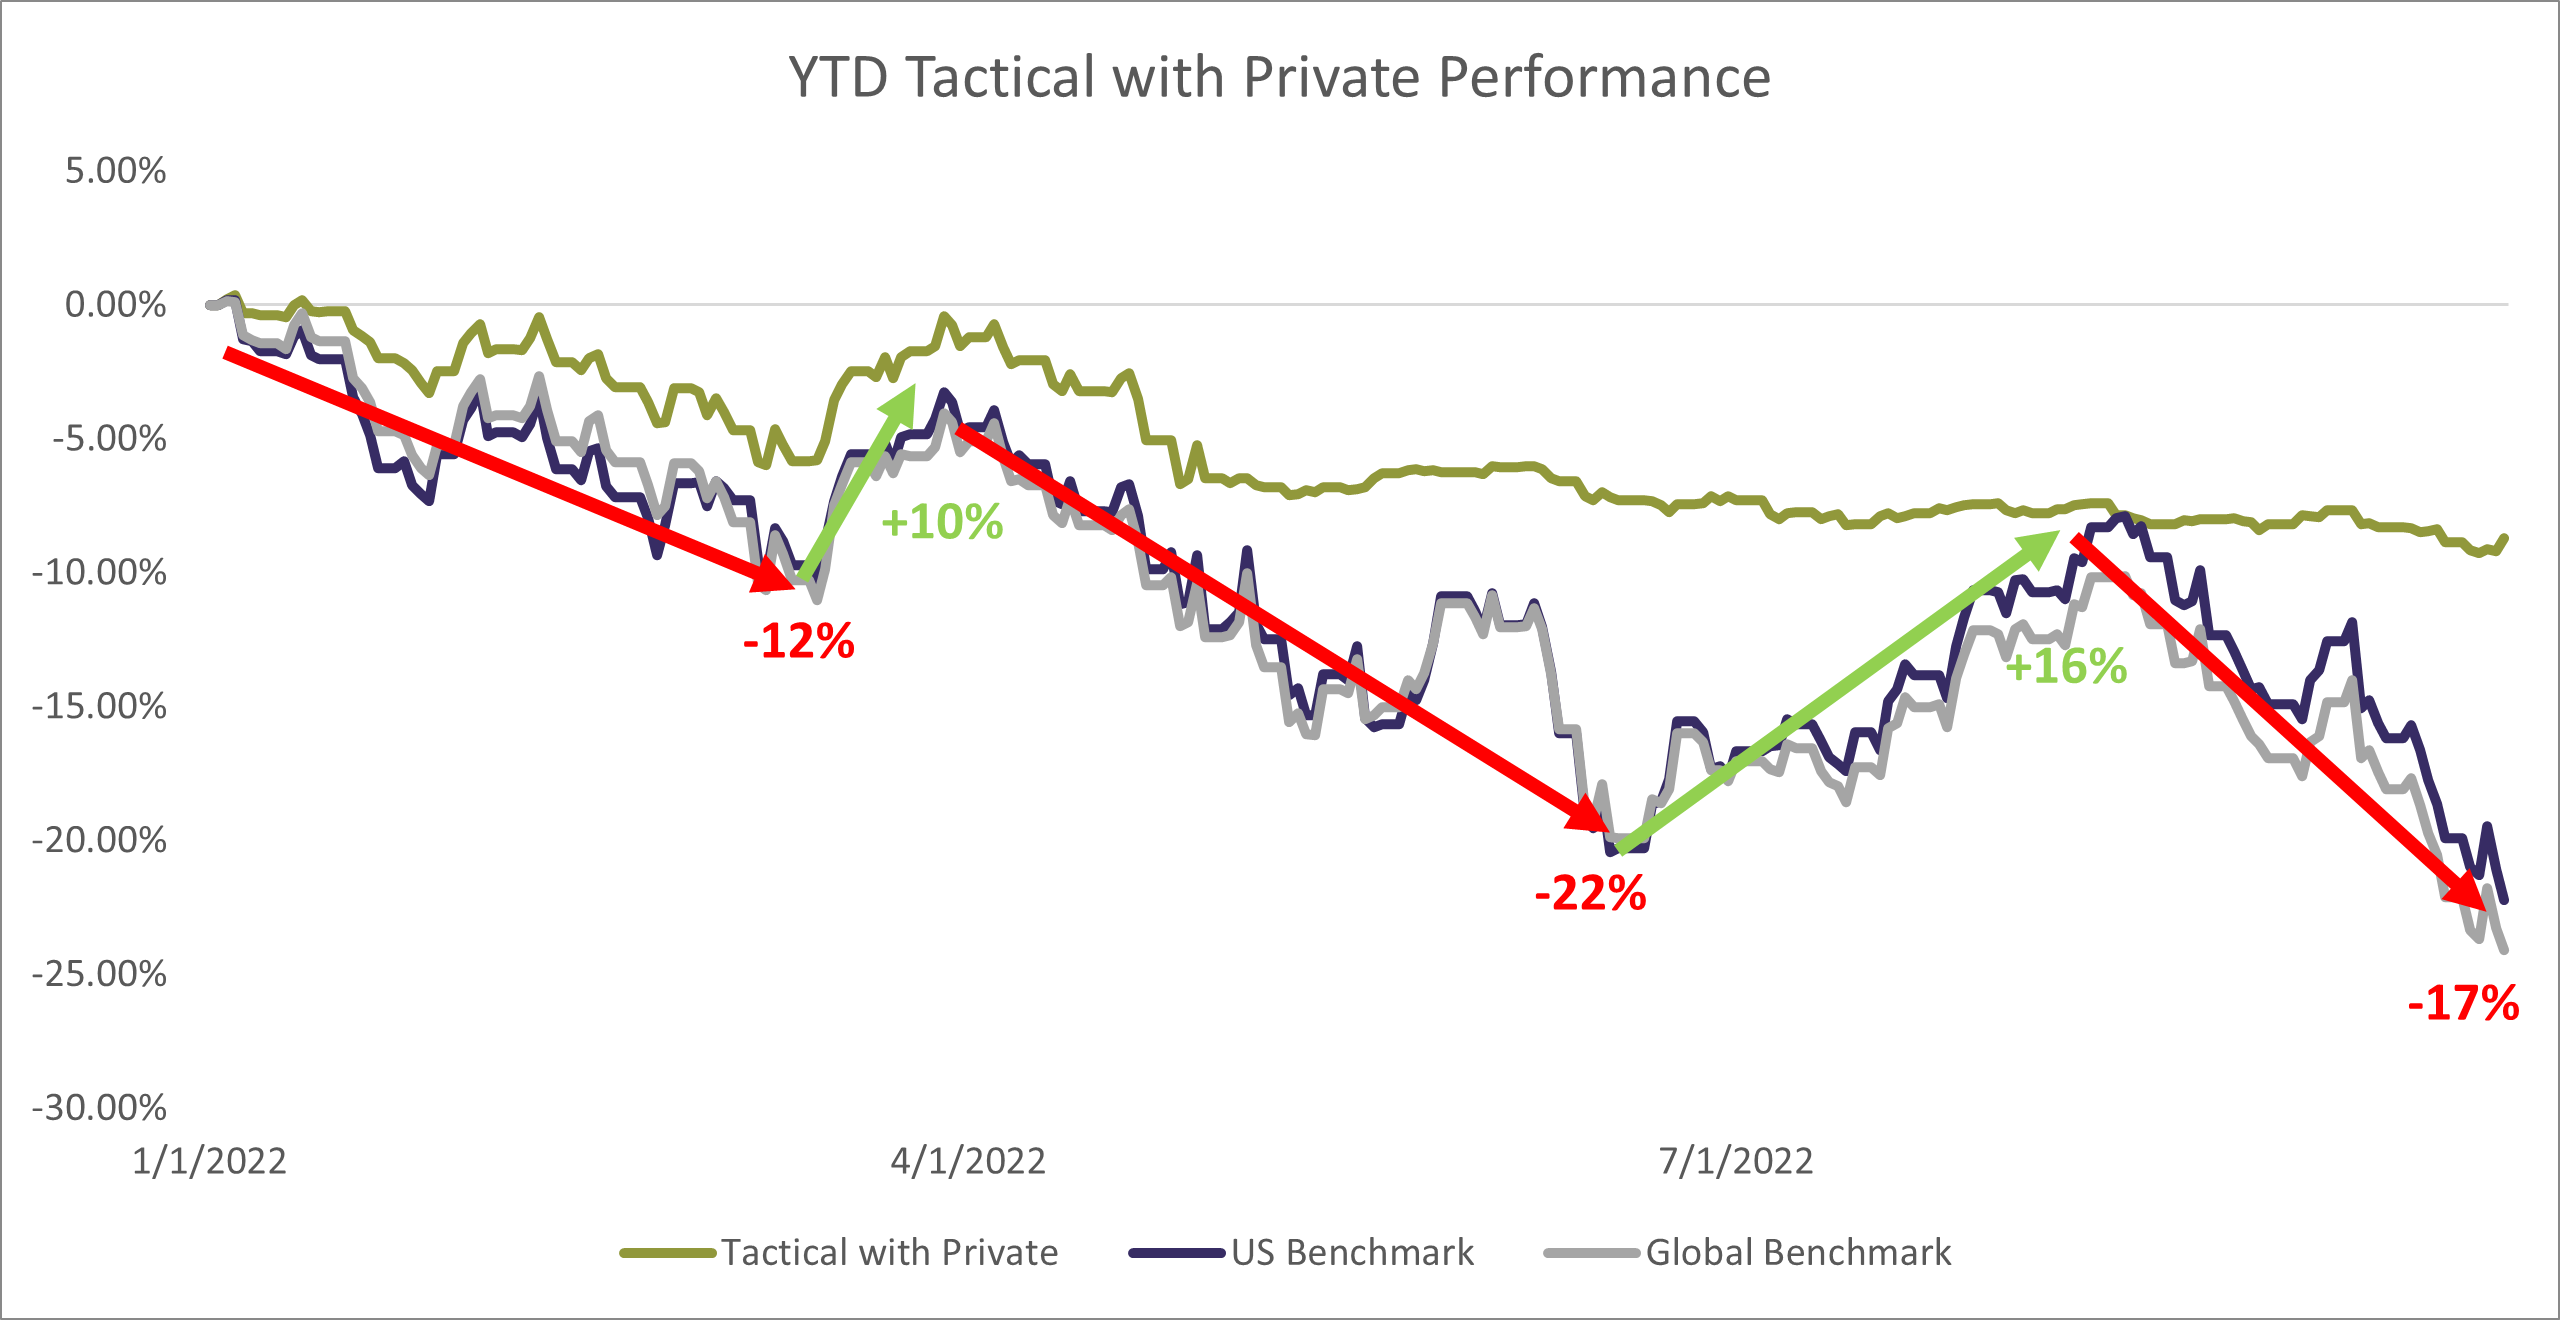
Clients that included private investments with their Tactical portfolio had even less market exposure, which further blunted market declines.
Chart V below illustrates an average LGA Tactical with Private portfolio positioned accordingly through this year’s large markets swings up (+10%, +16% rallies) and down (-12%, -22%, -17% drawdowns).
Chart V – LGA Tactical Portfolio with Private Performance (Source: LGA)
Across all portfolios, the LGA public investment team took advantage of the higher market volatility through targeted rebalancing, systematically selling high and buying low to achieve targeted levels of allocation and beta.
We will continue to use our internal quantitative models for deciding when it will be appropriate to increase exposure, but for now the portfolios remain defensive.
Private Market Update – Q3/2022
Louis Frank: Portfolio Manager, Private Market
Market volatility continued during Q3 as investors grappled with the Fed’s aggressive “inflation-fighting” rate hikes.
Rising rates have historically had a negative effect on investment assets and this time was no different, particularly in publicly traded securities (i.e., stocks/bonds).
In regards to private investments, we closely monitored our portfolio investments’ use of debt/leverage.
For several managers (especially in real estate), the last ten years have been full of opportunities to utilize historically cheap and stable debt.
This opportunity set diminished greatly over the past 12 months.
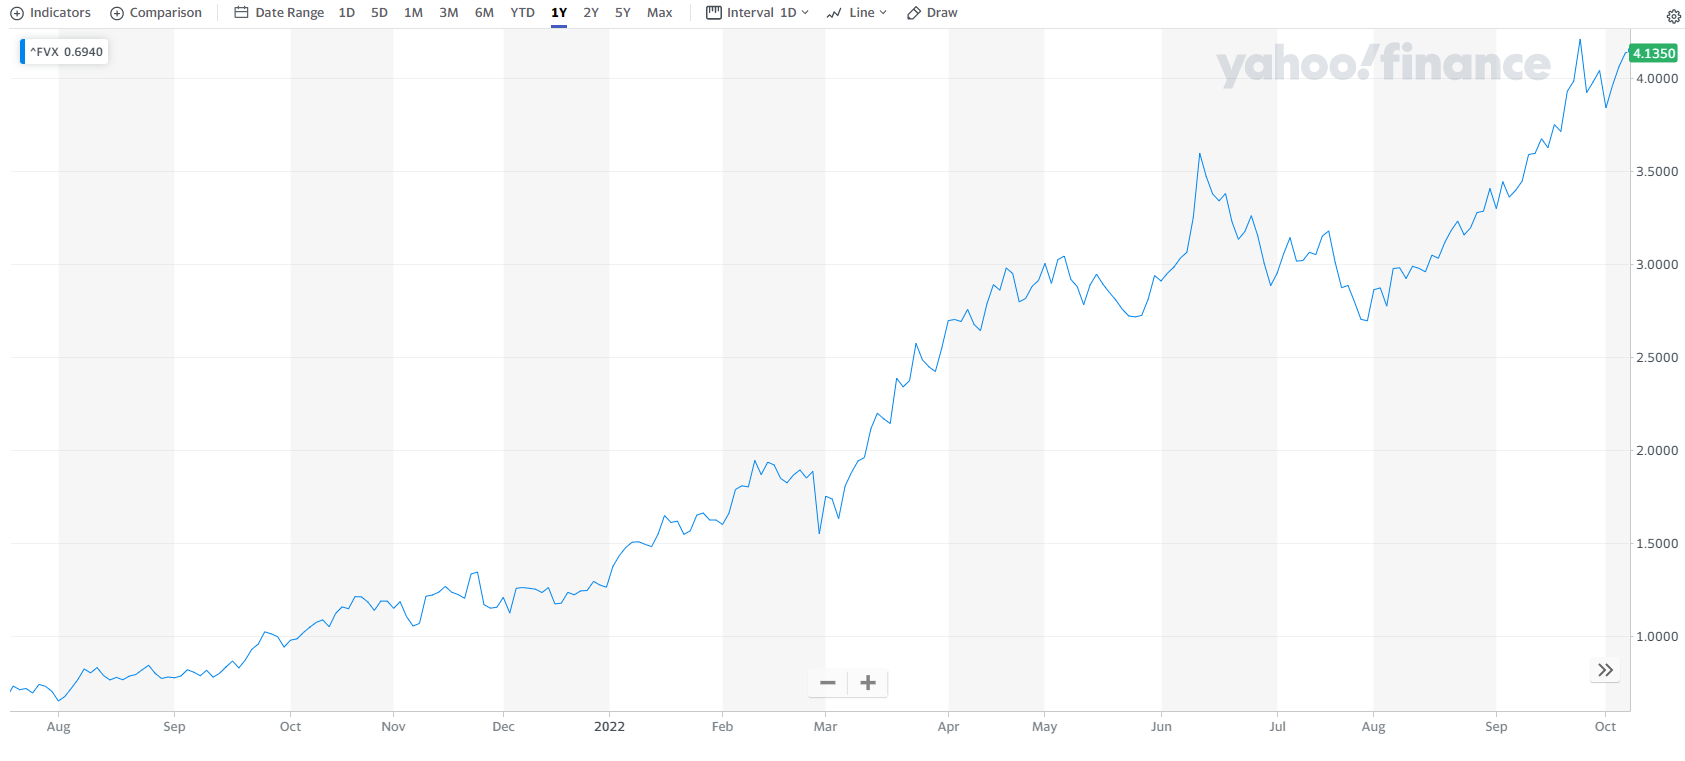
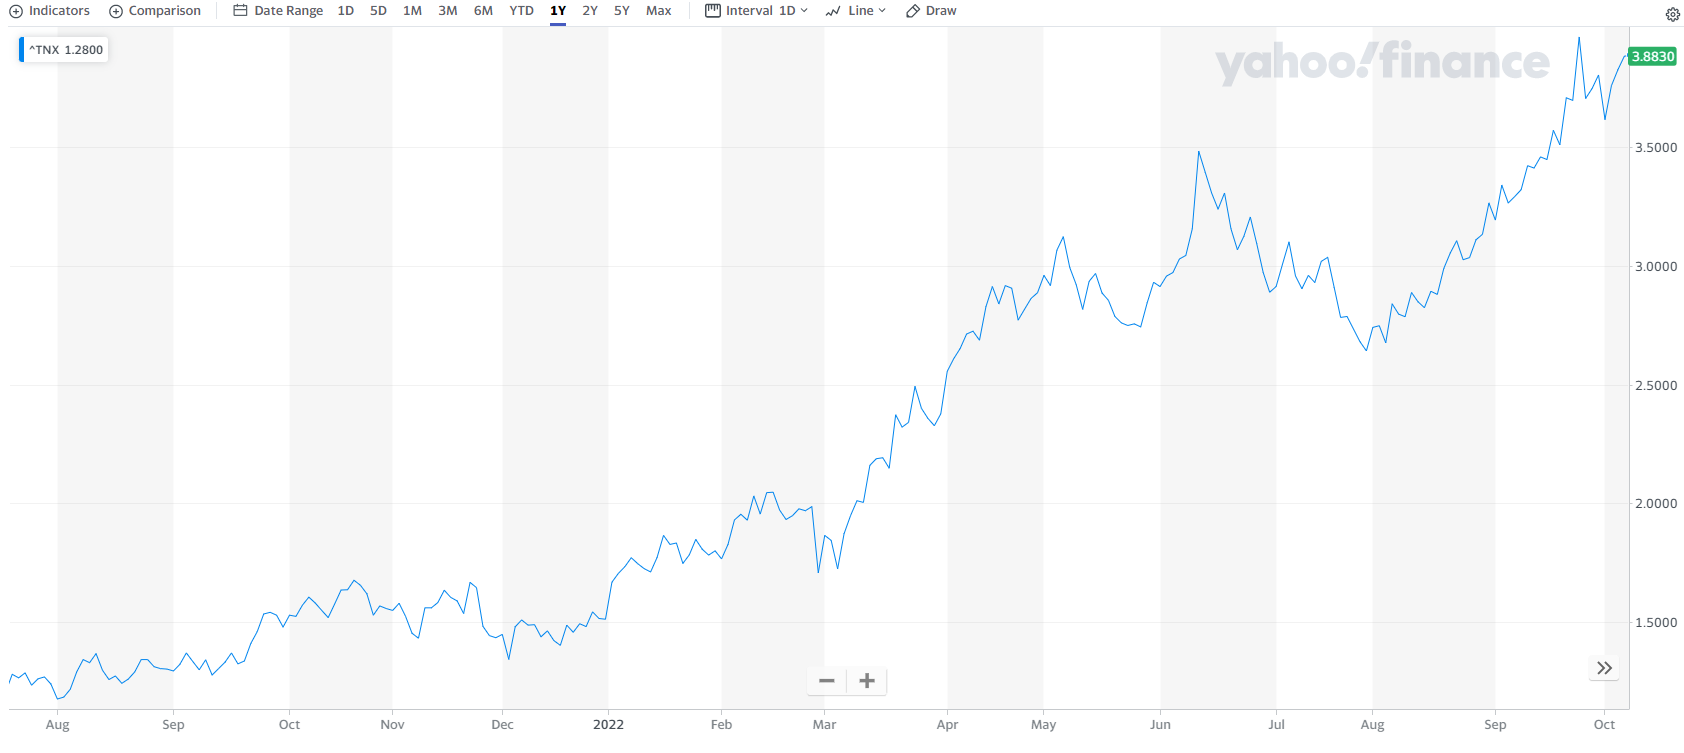
Many managers are now faced with financing options that are 2-4x comparable rates from a year ago (see the charts below):
Chart VI – 5-Year Treasury (Source: Yahoo Finance)
Chart VII – 10-Year Treasury (Source: Yahoo Finance)
These increasing finance costs can strain investment returns, depending on the debt structure.
We have particularly scrutinized managers use of fixed versus floating-rate debt.
The use of floating-rate debt (which moves up/down with interest rates) can cause potential issues in rising-rate environments.
In these rare scenarios, we worked to reduce exposure or encouraged partners to lock in with mid-to-longer term fixed rates.
We also invested in several private strategies that sell floating rate debt, allowing portfolios to benefit from rising rates.
On such example is “specialty finance,” which continued to be one of our strongest performers in this down market cycle.
We walk through one of our unique specialty finance opportunities below – Diamond Lending!
Specialty Finance Investment > Diamond-Backed Lending
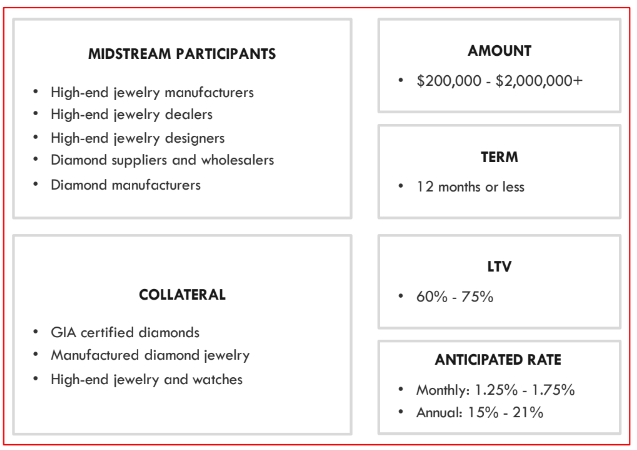
Diamond-backed lending employs the physical possession of diamonds (or high-end jewelry) as collateral against loans to industry participants that would like to leverage their owned assets in order to carry additional inventory.
Our lending partner uses a conservative 60-75% of wholesale value which can be 50 – 60%+ below retail pricing.
Please see the below sample financing characteristics:
Chart VIII – Financing Characteristics (Source: Fund specific marketing materials)
Below is an example of how the defensive loan-to-value works.
Market Value ofCollateral: $1,000,000
Wholesale Value of Collateral: $700,000
Fund Loan @ 75% LTV: $525,000
Investment LTV: 52.5% ($525,000 / $1,000,000)
The vast majority of loans payoff at attractive 15-20%+ annualized rates.
However, rarer default events can also be accretive, assuming our lending partner can sell the collateral at even wholesale prices.
Key Investment Characteristics:


 Two of our gauges remained the same from last quarter with US equity remaining bearish and a tilt to US vs Global equities.
There was a small change in the Fixed Income gauge, moving to a slightly less bearish reading.
Yields on 1-year treasuries eclipsed 4% this quarter, a level not seen in short term yields for over 12 years (see Chart II below)!
Consequently, we began reallocating more conservative clients to Fixed Income after many years of holding virtually zero assets in this area.
Two of our gauges remained the same from last quarter with US equity remaining bearish and a tilt to US vs Global equities.
There was a small change in the Fixed Income gauge, moving to a slightly less bearish reading.
Yields on 1-year treasuries eclipsed 4% this quarter, a level not seen in short term yields for over 12 years (see Chart II below)!
Consequently, we began reallocating more conservative clients to Fixed Income after many years of holding virtually zero assets in this area.

 Market volatility continued during Q3 as investors grappled with the Fed’s aggressive “inflation-fighting” rate hikes.
Rising rates have historically had a negative effect on investment assets and this time was no different, particularly in publicly traded securities (i.e., stocks/bonds).
In regards to private investments, we closely monitored our portfolio investments’ use of debt/leverage.
For several managers (especially in real estate), the last ten years have been full of opportunities to utilize historically cheap and stable debt.
This opportunity set diminished greatly over the past 12 months.
Many managers are now faced with financing options that are 2-4x comparable rates from a year ago (see the charts below):
Market volatility continued during Q3 as investors grappled with the Fed’s aggressive “inflation-fighting” rate hikes.
Rising rates have historically had a negative effect on investment assets and this time was no different, particularly in publicly traded securities (i.e., stocks/bonds).
In regards to private investments, we closely monitored our portfolio investments’ use of debt/leverage.
For several managers (especially in real estate), the last ten years have been full of opportunities to utilize historically cheap and stable debt.
This opportunity set diminished greatly over the past 12 months.
Many managers are now faced with financing options that are 2-4x comparable rates from a year ago (see the charts below):